Download
1 / 51
510 likes | 614 Views
Qualitative Simulation of the Carbon Starvation Response in Escherichia coli. Hidde de Jong 1 Delphine Ropers 1 Johannes Geiselmann 1,2 1 INRIA Grenoble-Rhône-Alpes 2 Laboratoire Adaptation Pathogénie des Microorganismes CNRS UMR 5163 Université Joseph Fourier

E N D
Qualitative Simulation of the Carbon Starvation Response in Escherichia coli Hidde de Jong1 Delphine Ropers1 Johannes Geiselmann1,2 1INRIA Grenoble-Rhône-Alpes 2Laboratoire Adaptation Pathogénie des Microorganismes CNRS UMR 5163 Université Joseph Fourier Email: Hidde.de-Jong@inrialpes.fr
Overview • Carbon starvation response of Escherichia coli • Modeling and simulation: objective and constraints • Qualitative modeling and simulation of carbon starvation • Experimental validation of carbon starvation model • Conclusions
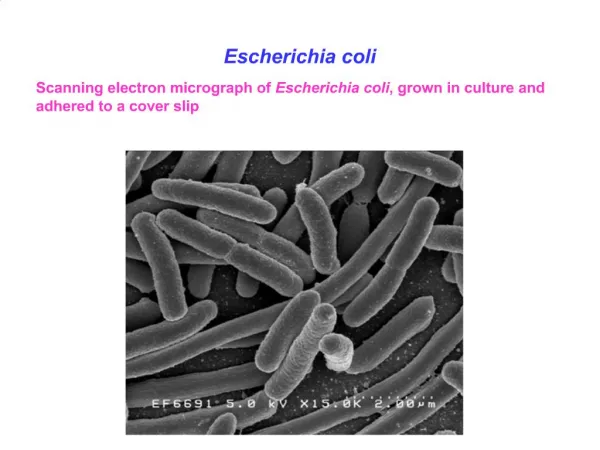
The average human gut contains about 1 kg of bacteria Approximatively 0.1% are Escherichia coli E. coli, along with other enterobacteria, synthesize vitamins which are absorbed by our body (e.g., vitamin K, B-complex vitamins) 1 µm 2 µm Rocky Mountain Laboratories, NIAID, NIH Escherichia coli
Escherichia coli stress responses • E. coli is able to adapt and respond to a variety of stresses in its environment Model organism for understanding adaptation of pathogenic bacteria to their host Storz and Hengge-Aronis (2000), Bacterial Stress Responses, ASM Press Heat shock Nutritional stress Cold shock Osmotic stress …
Nutritional stress response in E. coli • Response of E. coli to nutritional stress conditions: transition from exponential phase to stationary phase Changes in morphology, metabolism, gene expression, … log (pop. size) > 4 h time
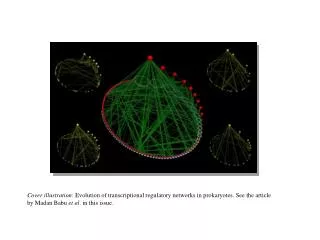
Cases et de Lorenzo (2005), Nat. Microbiol. Rev., 3(2):105-118 Network controlling stress response • Response of E. coli to nutritional stress conditions controlled by large and complex genetic regulatory network • No global view of functioning of network available, despite abundant knowledge on network components
First step: analysis of the carbon starvation response in E. coli fis P gyrAB P cya P1-P’1 P2 FIS GyrAB CYA DNA supercoiling cAMP•CRP Signal (lack of carbon source) protein TopA Ropers et al. (2006), BioSystems, 84(2):124-52 CRP gene tRNA rRNA topA P1-P4 promoter crp P1 P2 rrn P1 P2 Analysis of carbon starvation response • Objective: modeling and experimental studies directed at understanding how network controls nutritional stress response
Constraints on modeling and simulation • Current constraints on modeling and simulation: • Knowledge on molecular mechanisms rare • Quantitative information on kinetic parameters and molecular concentrations absent • Possible strategies to overcome the constraints • Parameter estimation from experimental data • Parameter sensitivity analysis • Model simplifications • Intuition: essential properties of system dynamics robust against moderate changes in kinetic parameters and rate laws Stelling et al. (2004), Cell, 118(6):675-86
Qualitative modeling and simulation • Qualitative modeling and simulation of large and complex genetic regulatory networks using simplified DE models • Applications of qualitative simulation: • initiation of sporulation in Bacillus subtilis • quorum sensing in Pseudomonas aeruginosa • onset of virulence in Erwinia chrysanthemi • Relation with discrete, logical models of gene regulation de Jong, Gouzé et al. (2004), Bull. Math. Biol., 66(2):301-40 Batt et al. (2007), Automatica, in press de Jong, Geiselmann et al. (2004), Bull. Math. Biol., 66(2):261-300 Viretta and Fussenegger, Biotechnol. Prog., 2004, 20(3):670-678 Sepulchre et al., J. Theor. Biol., 2007, 244(2):239-57 Thomas and d’Ari (1990), Biological Feedback, CRC Press
s-(x, θ) 1 0 x A x : protein concentration : threshold concentration . . B , : rate constants xaas-(xa, a2) s-(xb, b ) – axa xbbs-(xa, a1) – bxb b a PL differential equation models • Genetic networks modeled by class of differential equations using step functions to describe regulatory interactions • Differential equation models of regulatory networks are piecewise-affine (PA) Glass and Kauffman (1973), J. Theor. Biol., 39(1):103-29
maxb D1 kb/gb b . . . . xbb – bxb xaa – axa xaas-(xa, a2) s-(xb, b ) – axa xbbs-(xa, a1) – bxb 0 maxa a1 ka/ga a2 Mathematical analysis of PA models • Analysis of dynamics of PA models in phase space maxb b 0 maxa a1 a2
maxb b . . . . xaas-(xa, a2) s-(xb, b ) – axa xbbs-(xa, a1) – bxb xaa – axa xb– bxb 0 maxa a1 a2 Mathematical analysis of PA models • Analysis of dynamics of PA models in phase space maxb b D5 0 maxa a1 ka/ga a2
maxb b . . xaas-(xa, a2) s-(xb, b ) – axa xbbs-(xa, a1) – bxb 0 maxa a1 a2 Mathematical analysis of PA models • Analysis of dynamics of PA models in phase space • Extension of PA differential equations to differential inclusions using Filippov approach maxb b D3 0 maxa a1 a2 • Gouzé, Sari (2002), Dyn. Syst., 17(4):299-316
maxb b . . xaas-(xa, a2) s-(xb, b ) – axa xbbs-(xa, a1) – bxb 0 maxa a1 a2 Mathematical analysis of PA models • Analysis of dynamics of PA models in phase space • Extension of PA differential equations to differential inclusions using Filippov approach maxb b D7 0 maxa a1 a2 • Gouzé, Sari (2002), Dyn. Syst., 17(4):299-316
maxb D21 D24 D20 D18 D19 D23 D27 D26 D25 D21 D24 D20 D17 D16 D22 D25 D27 D26 b D19 D23 D14 D13 D15 D11 D10 D12 D18 D17 D22 D16 D1 D3 D5 D7 D9 D2 D4 D6 D8 D13 D11 D10 D15 D12 D14 0 maxa a1 a2 . . . xa = 0 xb < 0 xa > 0 xb < 0 . xa > 0 xb > 0 . . D7: D5: D1: D1 D9 D3 D5 D7 D2 D4 D6 D8 Qualitative analysis of network dynamics • Phase space partition: unique derivative sign pattern in regions • Qualitative abstraction yields state transition graph Shift from continuous to discrete picture of network dynamics maxb b 0 maxa a1 a2
D11 D12 maxb D1 maxb D3 kb/gb b D12 D11 b D3 D1 0 maxa a1 a2 0 maxa a1 ka/ga a2 Qualitative analysis of network dynamics • State transition graph invariant for parameter constraints 0 < qa1 < qa2 < a/a < maxa 0 < qb < b/b< maxb
D11 D12 maxb D1 maxb D3 kb/gb b D12 D11 b D3 D1 0 maxa a1 ka/ga a2 0 maxa a1 a2 Qualitative analysis of network dynamics • State transition graph invariant for parameter constraints 0 < qa1 < qa2 < a/a < maxa 0 < qb < b/b< maxb
D11 D12 maxb maxb D1 maxb maxb D3 kb/gb kb/gb b b D11 D12 D12 D11 b b D3 D3 D1 D1 0 0 maxa maxa a1 a1 ka/ga ka/ga a2 a2 0 0 maxa maxa a1 a1 a2 a2 Qualitative analysis of network dynamics • State transition graph invariant for parameter constraints 0 < qa1 < qa2 < a/a < maxa 0 < qb < b/b< maxb D11 0 < a/a < qa1 < qa2 < maxa 0 < qb < b/b< maxb D1
xa . . . . xa < 0 xa > 0 xb > 0 xb > 0 0 time xb D21 D24 D20 D25 D27 D26 0 D19 D23 D18 time D17 D22 D16 . . . xa= 0 xb= 0 xa < 0 xb > 0 . xa > 0 xb > 0 . . D18: D17: D1: D13 D11 D10 D15 D12 D14 D5 D1 D9 D3 D7 D4 D2 D6 D8 Validation of qualitative models • Predictions well adapted to comparison with available experimental data: changes of derivative sign patterns • Model validation: comparison of derivative sign patterns in observed and predicted behaviors • Need for automated and efficient tools for model validation Concistency? Yes
xa . . . . xb > 0 xa < 0 xb > 0 xa > 0 0 time xb D21 D24 D20 D25 D27 D26 0 D19 D23 D18 time D17 D22 D16 . . . . EF(xa > 0 xb > 0EF(xa < 0 xb > 0) ) D13 D11 D10 D15 D12 D14 D5 D1 D9 D3 D7 D4 D2 D6 D8 Verification using model checking • Compute state transition graph and express dynamic properties in temporal logic • Use of model checkers to verify whether experimental data and model predictions are consistent Concistency? Yes • Batt et al. (2005), Bioinformatics, 21(supp. 1): i19-28
D21 D24 D20 D25 D27 D26 D19 D23 D18 D17 D22 D16 maxb D13 D11 D10 D15 D12 D14 kb/gb b D1 D9 D5 D7 D3 D6 D2 D4 D8 0 maxa a1 a2 Analysis of attractors of PA systems • Search of attractors of PA systems in phase space maxb b 0 maxa a1 a2 • Analysis of stability of attractors, using properties of state transition graph Definition of stability of equilibrium points on surfaces of discontinuity Casey et al. (2006), J. Math Biol., 52(1):27-56
Distribution by Genostar SA Genetic Network Analyzer (GNA) • Qualitative simulation method implemented in Java: Genetic Network Analyzer (GNA) de Jong et al. (2003), Bioinformatics, 19(3):336-44 • Batt et al. (2005), Bioinformatics, 21(supp. 1): i19-28 http://www-helix.inrialpes.fr/gna
Bottom-up strategy: Initial model of carbon starvation response fis P gyrAB P cya P1-P’1 P2 FIS GyrAB CYA DNA supercoiling cAMP•CRP Signal (lack of carbon source) protein TopA CRP gene Ropers et al. (2006), BioSystems, 84(2):124-152 tRNA rRNA promoter topA P1-P4 crp P1 P2 rrn P1 P2 Analysis of carbon starvation response • Modeling and experimental studies directed at understanding how network controls carbon starvation response
Analysis of carbon starvation response • Modeling and experimental studies directed at understanding how network controls carbon starvation response • Bottom-up strategy: • Initial model of thecarbon starvation response Search and curate data available in the literature and databases • Experimental verification of model predictions • Extension of model to take into account wrong predictions • Additional global regulators: IHF, HNS, ppGpp, FNR, LRP, ArcA, …
fis P gyrAB P cya P1-P’1 P2 FIS GyrAB CYA Supercoiling Activation Signal (lack of carbon source) Superhelical density of DNA CRP•cAMP TopA CRP tRNA rRNA topA P1-P4 crp P1 P2 rrn P1 P2 Modeling of carbon starvation network • Modular structure of carbon starvation network Ropers et al. (2006), BioSystems,84(2):124-152
fis P gyrAB P cya P1-P’1 P2 FIS GyrAB CYA DNA supercoiling cAMP•CRP Signal (lack of carbon source) TopA CRP tRNA rRNA topA P1-P4 crp P1 P2 rrn P1 P2 Modeling of carbon starvation network • Can the initial model explain the carbon starvation response of E. coli cells? • Translation of biological data into a mathematical model
From nonlinear kinetic model to PA model • Modeling process consists of reducing classical nonlinear kinetic model to PA model Nonlinear kinetic model Quasi-steady state approximation Nonlinear reduced kinetic model Piecewise-linear approximation Piecewise-linear model
FIS rrn P1 P2 stable RNAs Nonlinear kinetic model • Nonlinear kinetic ODE model of 12 variables and 46 parameters • Regulation of gene expression (Hill)
K1 k2 k3 ATP + CYA* CYA*•ATP CYA* + cAMP degradation/export Nonlinear kinetic model • Nonlinear kinetic ODE model of 12 variables and 46 parameters • Regulation of gene expression (Hill) • Enzymatic reactions (Michaelis-Menten)
K4 cAMP + CRP CRP•cAMP Nonlinear kinetic model • Nonlinear kinetic ODE model of 12 variables and 46 parameters • Regulation of gene expression (Hill) • Enzymatic reactions (Michaelis-Menten) • Formation of biochemical complexes (mass action)
Quasi steady state approximation • Identification of slow and fast processes in network fis P gyrAB P cya P1-P’1 P2 FIS GyrAB CYA DNA supercoiling cAMP•CRP Signal (lack of carbon source) TopA CRP tRNA rRNA topA P1-P4 crp P1 P2 rrn P1 P2
Quasi steady state approximation • Identification of slow and fast processes in network • Change of variables and quasi steady-state approximation fis P gyrAB P cya P1-P’1 P2 FIS GyrAB CYA DNA supercoiling cAMP•CRP Signal (lack of carbon source) TopA CRP tRNA rRNA topA P1-P4 crp P1 P2 rrn P1 P2 Heinrich and Schuster (1996), The Regulation of Cellular Systems, Chapman & Hall
Nonlinear reduced model • QSSA model of 7 variables and46parameters
CYA CRP• cAMP Signal Activation crp P1 P2 CRP CYA concentration (M) CRP concentration (M) s+(xCYA, CYA1) s+(xCRP, CRP1) s+(xSIGNAL, SIGNAL) Piecewise-linear approximation • Approximation of Hill function with step function • Approximation of sigmoidal surfaces with product of step functions
Model of carbon starvation network • PADE model of 7 variables and 36 parameter inequalities
Attractors of stress response network • Analysis of attractors of PA model: two steady states • Stable steady state, corresponding to exponential-phase conditions • Stable steady state, corresponding to stationary-phase conditions
Simulation of stress response network • Simulation of transition from exponential to stationary phase State transition graph with 27 states, 1 stable steady state CRP GyrAB TopA CYA rrn FIS Signal
Insight into nutritional stress response • Sequence of qualitative events leading to adjustment of growth of cell after nutritional stress signal Role of the mutual inhibition of Fis and CRP•cAMP fis P gyrAB P cya P1-P’1 P2 FIS GyrAB CYA Supercoiling Activation Signal (lack of nutrients) Superhelical density of DNA CRP•cAMP TopA CRP tRNA rRNA topA P1-P4 crp P1 P2 rrn P1 P2
promoter region bla gfp or lux reporter gene cloning promoter regions on plasmid ori Reporter gene systems • Simulations yield predictions that cannot be verified with currently avaliable experimental data • Use of reporter gene systems to monitor gene expression rrnB fis crp nlpD rpoS topA gyrB gyrA
Monitoring of gene expression • Integration of fluorescent or luminescent reporter gene systems into bacterial cell Global regulator Global regulator E. coli genome E. coli genome emission excitation Reporter operon Reporter gene GFP Luciferase emission • Expression of reporter gene reflects expression of host gene of interest
Real-time monitoring: microplate reader • Use of automated microplate reader to monitor in parallel in single experiment expression of different reporter genes • fluorescence/luminescent intensity • absorbance (OD) of bacterial culture Well with bacterial culture Different gene reporter system in wells 96-well microplate • Upshift experiments in M9/glucose medium
Analysisofreportergene expression data • WellReader: program for analysis of reporter gene expression data
. . EF(xfis < 0EF(xfis = 0 xrrn < qrrn) ) Validation of carbon starvation response model • Translate expression profiles into temporal logic and verify properties by means of model checking Geiselmann et al (2007), in preparation “Fis concentration decreases and becomes steady in stationary phase” True
Validation of carbon starvation response model • Translate expression profiles into temporal logic and verify properties by means of model checking Geiselmann et al (2007), in preparation “GyrA concentration decreases at the onset of stationary phase” . False EF (xgyrA < 0 xrrn < qrrn)
Missing interaction in the network? Suggestion of missing interaction • Model does not reproduce observed downregulation of negative supercoiling fis P gyrAB P cya P1-P’1 P2 FIS GyrAB CYA Supercoiling Activation Signal (lack of nutrients) Superhelical density of DNA CRP•cAMP TopA CRP tRNA rRNA topA P1-P4 crp P1 P2 rrn P1 P2
Missing component in the network? P1 P2 nlpD rpoS fis P P gyrAB cya P1-P’1 P2 σS FIS GyrI GyrAB CYA gyrI Supercoiling P Stress signal Activation RssB TopA CRP tRNA rRNA topA P1-P4 P5 crp P1 P2 Ropers et al. (2006) PA PB rssA rssB rrn P1 P2 Extension of stress response network • Model does not reproduce observed downregulation of negative supercoiling
Perspectives • Refining model validation by monitoring gene expression in single cells • Inference of regulatory networks from gene expression data Use hybrid system identification methods adapted to PL models • Composite models of E. coli stress response on genetic and metabolic level • Integrated tools for model checking and qualitative simulation using high-level specification languages Prerequisite for further upscaling Collaboration with Irina Mihalcescu, Université Joseph Fourier Drulhe et al. (2007), IEEE Trans. Autom. Control/Circ. Syst. I, in press Collaboration with Daniel Kahn, INRA, and Jean-Luc Gouzé, INRIA Pedro T. Monteiro, PhD thesis, IST and UCBL
Conclusions • Understanding of functioning and development of living organisms requires analysis of genetic regulatory networks From structure to behavior of networks • Need for mathematical methods and computer tools well-adapted to available experimental data Coarse-grained models and qualitative analysis of dynamics • Biological relevance attained through integration of modeling and experiments Models guide experiments, and experiments stimulate models
Contributors and sponsors Grégory Batt, Université Joseph Fourier, Grenoble, France Bruno Besson, INRIA Rhône-Alpes, France Hidde de Jong, INRIA Rhône-Alpes, France Hans Geiselmann, Université Joseph Fourier, Grenoble, France Jean-Luc Gouzé, INRIA Sophia-Antipolis, France Radu Mateescu, INRIA Rhône-Alpes, France Michel Page, INRIA Rhône-Alpes/Université Pierre Mendès France, Grenoble, France Corinne Pinel, Université Joseph Fourier, Grenoble, France Delphine Ropers, INRIA Rhône-Alpes, France Tewfik Sari, Université de Haute Alsace, Mulhouse, France Dominique Schneider, Université Joseph Fourier, Grenoble, France Ministère de la Recherche, IMPBIO program INRIA, ARC program European Commission, FP6, NEST program Agence Nationale de la Recherche, BioSys program