Download
1 / 25
250 likes | 497 Views
Worlds Apart. Center for Economic and Policy Research Fundación Sistema Washington, April 7 2006. Inequality between countries Global inequality (a sketch). Inequality between countries (Concept 1 inequality). Three concepts of inequality defined. Concept 1 inequality.

E N D
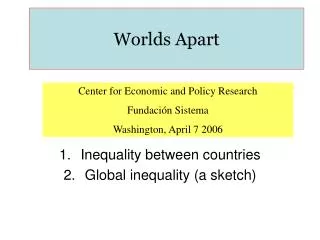
Worlds Apart Center for Economic and Policy Research Fundación Sistema Washington, April 7 2006 Inequality between countries Global inequality (a sketch)
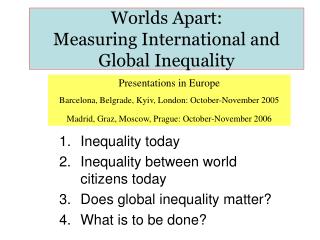
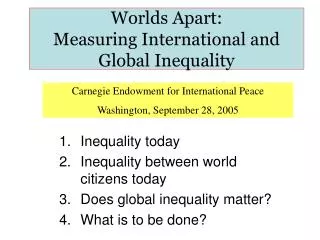
Three concepts of inequality defined Concept 1 inequality Concept 2 inequality Concept 3 (global) inequalty
Inequality, 1950-2000:The mother of all inequality disputes Global Inequality Concept 2 inequality Concept 1 inequality
Inequality between countries:Discontinuity in development trends around 1978-80 • The watershed years (Bairoch) • Tripling of oil prices • Increase in real interest rates (from –1% to +5% in the USA and the world) • Debt crisis • China’s responsibility system introduced • Latin American begins its “lost decade”, E. Europe/USSR “stagnate”
The outcome: • Middle income countries declined (Latin America, EEurope/former USSR) • China and India pulled ahead • Africa’s position deteriorated further • Developed world pulled ahead • World growth rate decreased by about 1 % (compared to the 1960-78 period)
Assessment • World income growth slowed down by 1 percentage point per capita p.a. • Poor and populous countries grew much faster and average (population-weighted) growth rate even increased • Countries’ growth record became much more diverse—and systematically so…Divergence
Growth over 1980-2002 period as function of initial (1980) income
Growth rate by each decile of countries, 1960-78 and 1978-2000 Deciles formed according to initial (1960 or 1978 income level)
Define four worlds: • First World: The West and its offshoots • Take the poorest country of the First World (e.g. Portugal) • Second world (the contenders): all those less than 1/3 poorer than Portugal. • Third world: all those 1/3 and 2/3 of the poorest rich country. • Fourth world: more than 2/3 below Portugal.
The key borders today • First to fourth world: Greece vs. Macedonia and Albania; Spain vs. Morocco (25km); Singapore vs. Indonesia • First to third world: US vs. Mexico; Germany vs. Poland; Austria vs. Hungary In 1960, the only key borders were Argentina and Uruguay (first) vs. Brazil, Paraguay and Bolivia (third world), and Australia (first) vs. Indonesia (fourth)
Poorer than during J.F. Kennedy Parts of Africa where 2000 GDI per capita is less than in 1963 (180m people ) US GDI per capita in the meantime doubled
First order dominance (year 1998) expressed in terms of percentile of world income distribution 100 France Brazil 80 60 Kazak Y98_c Sri Lanka 40 India-R 20 0 1 5 9 13 17 20 # of distribution groups twoway (line Y98_c group if year==1998 & contcod=="BRA") (line Y98_c group if year==1998 & contcod=="IDN-R") (line Y98_c group if year==1998 & contcod=="FRA") (line Y98_c group if year==1998 & contcod=="LKA"), legend(off) xtitle(country ventile) ytitle(percentile of world income distribution)
Same income for the top, different incomes for all the others 100 80 Hungary Ukraine 60 percentile of world income distribution Peru 40 20 0 5 10 15 20 country ventile
Conclusion: “The age of inequality”? Within-country inequalities have increased in many countries including in the largest (US, UK, China, India, Russia) Inequalities between countries have increased Population weighted inequality between countries went down thanks to fast growth in China and India (Caveat: acc. to Maddison it is almost stable + R/U differences in China and India have global implications) Inequality among people in the world is very high (Gini between 62 and 66) but its direction of change is not clear
Book “Worlds Apart: Measuring International and Global Inequality” • Email: bmilanovic@worldbank.org • Website: http://econ.worldbank.org/projects/inequality