Download
1 / 20
200 likes | 327 Views
Figure 13-1 Page 280. CHAPTER 13: CLIMATE CHANGE AND OZONE LOSS. Figure 13-2 (1) Page 281. Average temperature over past 900,000 years. 17. 16. 15. 14. Average surface temperature (°C). 13. 12. 11. 10. 9. 900. 800. 700. 600. 500. 400. 300. 200. 100. Present.

E N D
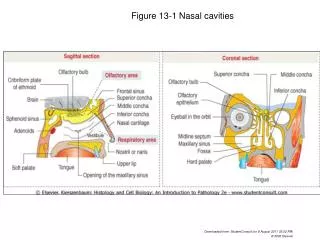
Figure 13-1 Page 280 CHAPTER 13: CLIMATE CHANGE AND OZONE LOSS
Figure 13-2 (1)Page 281 Average temperature over past 900,000 years 17 16 15 14 Average surface temperature (°C) 13 12 11 10 9 900 800 700 600 500 400 300 200 100 Present Thousands of years ago
Figure 13-2 (2)Page 2\81 Agriculture established Average temperature over past 10,000 years = 15°C (59°F) Temperature change over past 22,000 years 2 1 0 -1 End of last ice age Temperature change (°C) -2 -3 -4 -5 20,000 10,000 2,000 1,000 200 100 Now Years ago
Figure 13-2 (3)Page 281 Temperature change over past 1,000 years 1.0 0.5 0.0 Temperature change (°C) -0.5 -1.0 1000 1100 1200 1300 1400 1500 1600 1700 1800 1900 2000 2101 Year
Figure 13-2 (4)Page 281 Average temperature over past 130 years 15.0 14.8 14.6 14.4 Average surface temperature (°C) 14.2 14.0 13.8 13.6 1860 1880 1900 1920 1940 1960 1980 2000 2020 Year
Figure 13-3Page 283 380 360 340 320 300 Concentration of carbon dioxide in the atmosphere (ppm) 280 Carbon dioxide 260 240 +2.5 220 0 200 Variation of temperature (˚C) from current level –2.5 180 –5.0 –7.5 Temperature change –10.0 End of last ice age 160 120 80 40 0 Thousands of years before present
Figure 13-4 (2)Page 283 2.4 1.8 Parts per million 1.2 0.6 1800 1900 2000 2100 Year Methane (CH4)
Figure 13-4 (3)Page 283 320 310 Parts per million 300 290 260 1800 1900 2000 2100 Year Nitrous oxide (N2O)
Figure 13-5Page 285 14.7 8.4 380 8.0 14.6 375 7.6 14.5 7.2 14.4 365 6.8 14.3 Fossil fuels burn (billions of metric tons of oil equivalent) CO2 concentration (ppm) Temperature (Cº) 355 6.4 14.2 6.0 345 14.1 5.6 14.0 335 5.2 13.9 13.8 4.8 325 1970 1980 1990 2000 2005 Year
Figure 13-10Page 288 Greenland Greenland Antarctica
Figure 13-11Page 289 Today’s sea level 0 0 Height above or below present sea level (feet) Height above or below present sea level (meters) –130 –426 250,000 200,000 150,000 100,000 50,000 0 Years before present Present
Agriculture Water Resources Forests Figure 13-12Page 291 POSSIBLE EFFECTS OF A WARMER CLIMATE • Shifts in food-growing areas • Changes in crop yields • Increased irrigation demands • Increased pests, crop diseases, and weeds in warmer areas • Changes in forest composition and locations • Disappearance of some forests • Increased fires from drying • Loss of wildlife habitat and species • Changes in water supply • Decreased water quality • Increased drought • Increased flooding Biodiversity Sea Level and Coastal Areas • Rising sea levels • Flooding of low-lying islands and coastal cities • Flooding of coastal estuaries, wetlands, and coral reefs • Beach erosion • Disruption of coastal fisheries • Contamination of coastal aquifiers with salt water • Extinction of some plant and animal species • Loss of habitats • Disruption of aquatic life Weather Extremes Human Health • Increased deaths from heat and disease • Disruption of food and water supplies • Spread of tropical diseases to temperate areas • Increased respiratory disease and pollen allergies • Increased water pollution from coastal flooding Human Population • Prolonged heat waves and droughts • Increased flooding from more frequent, intense, and heavy rainfall in some areas • Increased deaths • More environmental refugees • Increased migration
Figure 13-13Page 291 • Less severe winters • More precipitation in some dry areas • Less precipitation in some wet areas • Increased food production in some areas • Expanded population and range for some plant and animal species adapted to higher temperatures GENERALIZED SUMMARY OF EFFECTS OF GLOBAL WARMING WHAT ABOUT CANADA VS. U.S. VS. MEXICO GEOGRAPHIC RANGE OF MANY SPECIES WILL CHANGE WHO WERE THE SAXONS? WHY DID THEY COME TO ENGLAND?
Figure 13-15 Page 293 Global Warming Prevention Cleanup Cut fossil fuel use (especially coal) Shift from coal to natural gas Transfer energy efficiency and renewable energy technologies to developing countries Improve energy efficiency Shift to renewable energy resources Reduce deforestation Use sustainable agriculture Limit urban sprawl Reduce poverty Slow population growth Remove CO2 from smokestack and vehicle emissions Store (sequester) CO2 by planting trees Sequester CO2 underground Sequester CO2 in soil by using no-till cultivation and taking crop land out of production Sequester CO2 in the deep ocean Repair leaky natural gas pipelines and facilities Use feeds that reduce CH4 emissions by belching cows
Figure 13-19Page 297 Summary of Reactions CCl3F + UV Cl + CCl2F Cl + O3 ClO + O2 Cl + O Cl + O2 Repeated many times Ultraviolet light hits a chlorofluorocarbon (CFC) molecule, such as CFCl3, breaking off a chlorine atom and leaving CFCl2. MECHANISM OF OZONE DEPLETION IN STRATOSPHERE Sun Cl Cl C Once free, the chlorine atom is off to attack another ozone molecule and begin the cycle again. Cl F UV radiation Cl Cl O O A free oxygen atom pulls the oxygen atom off the chlorine monoxide molecule to form O2. The chlorine atom attacks an ozone (O3) molecule, pulling an oxygen atom off it and leaving an oxygen molecule (O2). Cl Cl O O O O O Cl The chlorine atom and the oxygen atom join to form a chlorine monoxide molecule (ClO). O O O
Figure 13-20Page 298 400 October monthly means 350 300 Total ozone (Dobson units) 250 200 150 100 1955 1960 1965 1970 1975 1980 1985 1990 1995 2000 2005 Year
Figure 13-21Page 298 35 August 7, 2001 30 October 10, 2001 25 SUMMER 20 WINTER Altitude (kilometers) 15 10 SEASONAL CHANGE IN OZONE OVER ANARTICA 5 0 5 10 15 Ozone partial pressure (milipascals)
Figure 13-22Page 299 Human Health • Worse sunburn • More eye cataracts • More skin cancers • Immune system suppression Food and Forests • Reduced yields for some crops • Reduced seafood supplies from reduced phytoplankton • Decreased forest productivity for UV-sensitive tree species Wildlife • Increased eye cataracts in some species • Decreased population of aquatic species sensitive to UV radiation • Reduced population of surface phytoplankton • Disrupted aquatic food webs from reduced phytoplankton Air Pollution and Materials • Increased acid deposition • Increased photochemical smog • Degradation of outdoor paints and plastics Global Warming • Accelerated warming because of decreased ocean uptake of CO2 from atmosphere by phytoplankton and CFCs acting as greenhouse gases EFFECTS OF OZONE DEPLETION
Ultraviolet A Figure 13-23Page 300 Ultraviolet B Thin layer of dead cells Hair Epidermis Squamous cells Basal layer Sweat gland Melanocyte cells Dermis Basal membrane Blood vessels Squamous Cell Carcinoma Basal Cell Carcinoma Melanoma
Figure 13-24Page 301 15,000 No protocol 12,000 1987 Montreal Protocol 9,000 Abundance (parts per trillion) 6,000 1992 Copenhagen Protocol 3,000 0 1950 1975 2000 2025 2050 2075 2100 Year