Download
1 / 34
350 likes | 461 Views
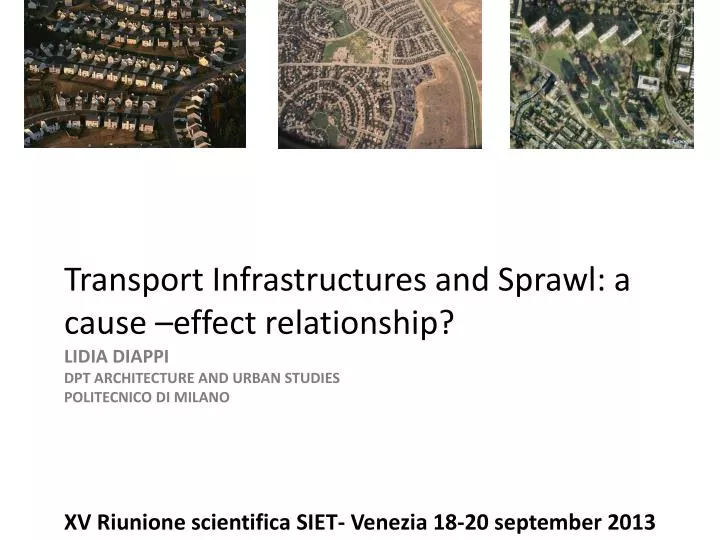
Transport Infrastructures and Sprawl: a cause –effect relationship?. Lidia Diappi Dpt architecture and urban studies Politecnico di milano. XV Riunione scientifica SIET- Venezia 18-20 september 2013. Scattered Urbanisation and Roads.

E N D
Transport Infrastructures and Sprawl: a cause –effect relationship? Lidia DiappiDptarchitecture and urbanstudiesPolitecnico di milano XV Riunione scientifica SIET- Venezia 18-20 september 2013
ScatteredUrbanisation and Roads Many theories and models (LUTI models in particular) are all based on the assumption that the road, and the generated accessibility, is the true engine of urbanization . RESEARCH QUESTION To what extent the actual pattern and dynamics of urbanization are explained by the proximity to the roads?
The discovery of complexity in planning implies to change our cognitive approach to reality
The new point of view: macro scale phenomena are often the result of emergent properties at micro scale The knowledge of the city Complex approach Linear approach
The extraction of location rules in urban sprawl: Combining NN investigation capabilities with spatial logic of CA The city as a complex system Three eggs diagram,Cedric Price Centrifugal and centripetal forces
Case study: the urbanization in the South Park of Milan: a model • The aim of this work is to investigate and built up a dynamic model of the process of urban sprawl . • The Land Use Transition Rules are identified by a Neural Network learning of Data concerning the spatio/temporal evolution. • The Rules are then applied in order to produce a possible scenario. • The approach enables to identify the most relevant variables affecting the process.
The AREAThe agricultural park South Milan 43.600 Ha.
The objects referred to in macrostructural models of cognitive processing are seen as approximate descriptors of emergent properties of the microstructure PDP Research group, 1986 NEW TOOLS IN DISCOVERING RULES OF CHANGE e Neural networksand cellular automata
Two assumptions: • Cellular Automata: A local change in land use is function of the neighbouring land uses • A bottom up (inductive) approach : knowledge endogenously built up through data processing which discover “ a posteriori” the rules of change (Neurocomputing)
Trezzano / Cesano Pantigliate / Paullo San Giuliano / San Donato Abbiategrasso Rozzano Melegnano Binasco TheCell Grid
1980 1994 • %Residence • % Industry • % Commerce • Dist. Road Cell land uses a T2 The DATA % Residence % Industry % Commerce Dist. Road Cell Land uses T1 % Residence % Industry % Commerce Dist. Road Nhb land uses T1 • X 2703 Cells (500 x500 mt)
c11 c12 c13 c14 c21 c22 c23 c24 c31 c32 c33 c34 c41 c42 c43 c44 SOM clusters : a map (1980-1994)
Codebooks range, values over the mean CR80 Cell, residential, 1980 CP80 Cell, productive, 1980 Codebooks range, values under the mean Codebook CC80 Cell, commercial, 1980 RD Road distance NR80 Neighbourhood, residential, 1980 NP80 Neighbourhood, productive, 1980 NC80 Neighbourhood, commercial, 1980 CR94 Cell, residential, 1994 CP94 Cell, productive, 1994 CC94 Cell, commercial, 1994
Codebooks range, values over the mean CR80 Cell, residential, 1980 CP80 Cell, productive, 1980 Codebooks range, values under the mean Codebook CC80 Cell, commercial, 1980 RD Road distance NR80 Neighbourhood, residential, 1980 NP80 Neighbourhood, productive, 1980 NC80 Neighbourhood, commercial, 1980 CR94 Cell, residential, 1994 CP94 Cell, productive, 1994 CC94 Cell, commercial, 1994 Green cells Far from the roadsnothinghappens
Codebooks range, values over the mean CR80 Cell, residential, 1980 CP80 Cell, productive, 1980 Codebooks range, values under the mean Codebook CC80 Cell, commercial, 1980 RD Road distance NR80 Neighbourhood, residential, 1980 NP80 Neighbourhood, productive, 1980 NC80 Neighbourhood, commercial, 1980 CR94 Cell, residential, 1994 CP94 Cell, productive, 1994 CC94 Cell, commercial, 1994 Green cells Close to the road, BUT stillnothinghappens!
Codebooks range, values over the mean CR80 Cell, residential, 1980 CP80 Cell, productive, 1980 Codebooks range, values under the mean Codebook CC80 Cell, commercial, 1980 RD Road distance NR80 Neighbourhood, residential, 1980 NP80 Neighbourhood, productive, 1980 NC80 Neighbourhood, commercial, 1980 CR94 Cell, residential, 1994 CP94 Cell, productive, 1994 CC94 Cell, commercial, 1994 Residential Land Use Infilling of consolidated urban areas Or New settlements in open areas Roads are not so close…
Codebooks range, values over the mean CR80 Cell, residential, 1980 CP80 Cell, productive, 1980 Codebooks range, values under the mean Codebook CC80 Cell, commercial, 1980 RD Road distance NR80 Neighbourhood, residential, 1980 NP80 Neighbourhood, productive, 1980 NC80 Neighbourhood, commercial, 1980 CR94 Cell, residential, 1994 CP94 Cell, productive, 1994 CC94 Cell, commercial, 1994 Commerce • Close to prexisting commercial settlements. • No surroundingurbanization. • Goodaccessibility to the roads
And the industrial settlements? Infilling of preexisting industrial zones close to main roads But also…. New industral settlm. In areas scattered unurbanised and poorly accessible
1.0 0.9 0.8 0.7 0.6 0.5 a - Residential Frequency 0.4 0.3 0.2 0.1 0.0 c44 c43 c42 0 c41 c34 0 < X <= 10 c33 10 < X <= 20 c32 20 < X <= 30 c31 30 < X <= 40 c24 Clusters 40 < X <= 50 c23 c22 50 < X <= 60 Growth % c21 60 < X <= 70 c14 70 < X <= 80 c13 80 < X <= 90 c12 90 < X <= 100 c11 1.0 b- Industrial 0.9 0.8 0.7 0.6 0.5 0.4 Frequency 0.3 0.2 0.1 0.0 1.0 c44 0.9 c43 0.8 c42 0.7 0 c41 Clusters c34 0 < X <= 10 0.6 c33 0.5 10 < X <= 20 c32 Frequency 0.4 20 < X <= 30 Growth % c31 0.3 30 < X <= 40 c24 0.2 40 < X <= 50 c23 0.1 c22 0.0 50 < X <= 60 c21 60 < X <= 70 c - Commercial c14 70 < X <= 80 c13 80 < X <= 90 c12 90 < X <= 100 c11 Clusters Growth % c44 c43 c42 0 c41 c34 0 < X <= 10 c33 10 < X <= 20 c32 20 < X <= 30 c31 30 < X <= 40 c24 40 < X <= 50 c23 c22 50 < X <= 60 c21 60 < X <= 70 c14 70 < X <= 80 c13 80 < X <= 90 c12 90 < X <= 100 c11 The transitionprobabilities
c11 c12 c13 c14 c21 c22 c23 c24 c31 c32 c33 c34 c41 c42 c43 c44 Classi di dinamica 80-94 Classi di dinamica 94-08
1980 confine 1994 ferrovie autostrade strade principali altre strade 0 - 10 10 - 20 20 - 30 30 - 40 40 - 50 50 - 60 60 - 70 70 - 80 80 - 90 90 - 100 2008 Residence
confine Incremento 80-94 ferrovie autostrade strade principali altre strade 0 - 10 10 - 20 20 - 30 30 - 40 40 - 50 50 - 60 60 - 70 70 - 80 80 - 90 90 - 100 Incremento 94-08 Residence
1980 confine 0 - 10 ferrovie 10 - 20 autostrade 20 - 30 strade principali 30 - 40 altre strade 40 - 50 50 - 60 1994 60 - 70 70 - 80 80 - 90 90 - 100 2008 Industry
confine 0 - 10 ferrovie 10 - 20 Incremento 80-94 autostrade 20 - 30 strade principali 30 - 40 altre strade 40 - 50 50 - 60 60 - 70 70 - 80 80 - 90 90 - 100 Incremento 94-08 Industry
1980 confine 0 - 10 ferrovie 10 - 20 autostrade 20 - 30 strade principali 30 - 40 altre strade 40 - 50 50 - 60 60 - 70 70 - 80 80 - 90 1994 90 - 100 2008 Commerce
confine 0 - 10 ferrovie Incremento 80-94 10 - 20 autostrade 20 - 30 strade principali 30 - 40 altre strade 40 - 50 50 - 60 60 - 70 70 - 80 80 - 90 90 - 100 Incremento 94-08 Commerce
Compactness Index Zi, Zj – areas of cells i and j >0 dij – distance among centroids i and j N – number of urbanized cells
Perimeter/ Area Ratio New urbanizedcells AllurbanizedCells
1980 1985 1990 1995 2000 2005 90% 70 80% 60 70% 50 60% incremento residenza 40 50% incremento produttivo 40% 30 incremento commercio 30% kmq residenza 20 20% kmq produttivo 10 10% kmq commercio 0% 0 incr % 8094 incr % 9408
Conclusions Eclecticapproachwhere the NN capabilities of investigationcope with a stochastic model able to produce sound scenario of urbanizationbased on fuzzyruleslearned by the NN. The mainland use transitionsconcern: infilling of alreadyurbanizedareas edges of urban centers and emerging nuclei in the green areas, whichgraduallybecomebigger Actractivness for central living and services and facilitiesoffered by the urban centers seem to explain the expansionaround the urbannucle (Ewingand Cervero, 2001, 2010). A kind a centrifugal force isshaping the urbanform.
Conclusions/2 The new cells tend to root around clusters with same land use The two phases- calibrated and simulated- show an initial period where urbanization occur in nuclei external to the urban centers with settlements extending in large slot sizes ans a second phase where infilling occurs with smaller size lots. Proximity to the main roads doesn’t play a crucial role in the spatial logic of the process.
The challenge of complexity THANK YOU !!