Download
1 / 54
540 likes | 817 Views
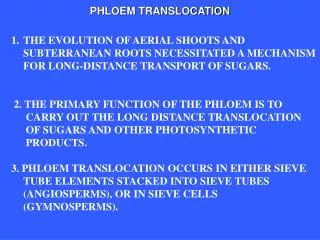
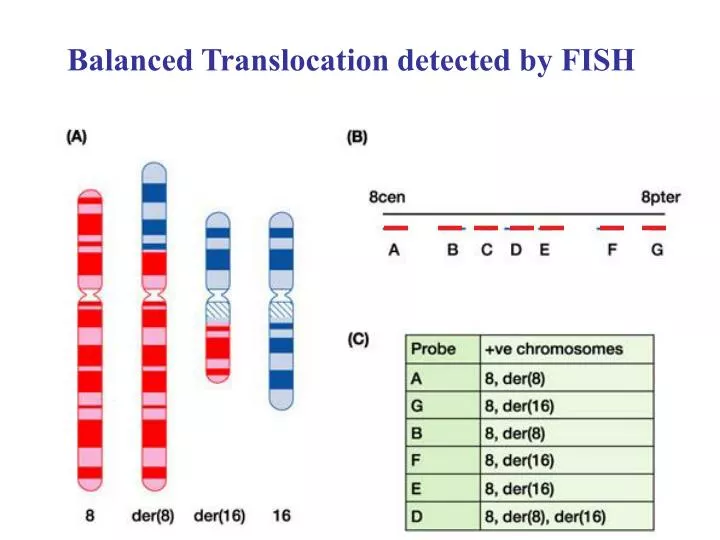
Balanced Translocation detected by FISH. Red- Chrom. 5 probe. Green- Chrom. 8 probe. 2D Protein Gels. MS-peptide size signature: match to all predicted proteins. Positional Cloning by Recombination Mapping. Follow the mutation 2. Follow which regions of DNA are

E N D
Red- Chrom. 5 probe Green- Chrom. 8 probe
Positional Cloning by Recombination Mapping Follow the mutation 2. Follow which regions of DNA are co-inherited (linked)
Positional Cloning by Recombination Mapping Follow the mutation To determine disease gene presence or absence (genotype) from phenotype you must first establish Dominant / recessive Aurosomal / sex-linked
SINGLE GENE DEFECTS Modes of Inheritance To deduce who (likely) has one or two copies of mutant gene Unaffected Male Affected Female
+/+ D/+ +/+ D/+ AUTOSOMAL DOMINANT
a/+ a/+ +/Y x/+ x/+ +/Y a/a x/Y RECESSIVE RECESSIVE X-LINKED AUTOSOMAL
Positional Cloning by Recombination Mapping 2. Follow which DNAs are co-inherited (linked) Use DNA sequences that differ among individuals within a family- Polymorphisms. T G C A
A1 A3 A1 A1 A2 A2 A4 A4 A3 A3 A3 A1 A4 A2
A1 B1 C1 X 2 3 Parent A2 B2 C2 A2 B1 C1 X Gamete A2 B1 C1 X Child
Recombination Mapping Measures distance between 2 sites on a chromosome according to frequency of recombination Distance between 2 DNA markers or Distance between a “disease gene” and a DNA marker
No fixed proportional Conversion between Genetic distance (cM) and Physical distance (kb, Mb)
FAMILY A A1 D A2 + NR NR NR NR NR R D + D D + D
FAMILY B A1 D A2 + A1 + A2 D NR NR NR NR NR R R R R R R NR
INFORMATIVE MEIOSIS Ideally:- unambiguous inheritance of mutation and markers (requires heterozygosity for each in parent) knowledge of which alleles linked in parent (phase)
Assign numbers to results of linkage analysis to deal with non-ideal meioses to sum data from many meioses in a family to sum data from several families
If unlinked:- Z = Lod = log { L ( ) / L (1/2)} 0.1 0.2 0.3 0.4 0.5 Z 0.58 0.62 0.51 0.3 0 If linked and RF = 1/2 Likelihood of R 1 - Likelihood of NR 1/2 Family A has 1 recombinant and 5 Non-Recombinants Likelihood, given linkage of Or given unlinked:- 5 = . (1- ) L ( ) 6 L (1/2) = (1/2)
Z = 3 Lod q
FAMILY B A1 D A2 + A1 + A2 D NR NR NR NR NR R R R R R R NR
Family B:- Disease gene may be linked to A1 or A2 5 5 + . (1- ) = . (1- ) 1/2 { } 1/2 { } L ( ) 6 L (1/2) = (1/2) Z = Lod = log { L ( ) / L (1/2)} 0.1 0.2 0.3 0.4 0.5 Z 0.28 0.32 0.22 0.08 0 Consider equally likely 50% chance Family B has 1 R and 5 NR 50% chance Family B has 5 R and 1 NR
0.1 0.2 0.3 0.4 0.5 Z 0.58 0.62 0.51 0.3 0 Phase known Phase unknown 0.1 0.2 0.3 0.4 0.5 Z 0.28 0.32 0.22 0.08 0
For family “A” with meioses 1, 2, 3, 4 ….. Z = Z1 + Z2 + Z3 + Z4 +….. For multiple families, “A”, “B”, “C”, “D”….. Z = Z(A) + Z(B) + Z(C) + Z(D) + …. Assumption: same gene responsible for disease in all families Problem: locus heterogeneity
Z = 3 Lod q
LINKAGE DISEQUILIBRIUM Many generations
Family Trio SNP genotypes reveal haplotypes Aa BB CC DD Ee FF Gg HH II JJ AA BB CC Dd Ee FF GG HH II Jj Mother Father AA BB CC Dd Ee FF Gg HH II JJ Son/Daughter A B C d E/e F G H I J A B C D E/e F g H I J a B C D e/E F G H I J A B C D e/E F G H I j Deduced haplotypes- ignoring recombination
Creation of variant sequences Rearrangement of sequence variants by recombination First, consider just the creation of variant sequences within a short stretch of DNA where there is no significant rearrangement due to recombination (an assumption that turns out to be valid)
b bq bqk bqkh g ga gar garn f ABCDEFGHIJKLMNOPQRST AbCDEFGHIJKLMNOPQRST ABCDEFgHIJKLMNOPQRST AbCDEFGHIJKLMNOPqRST aBCDEFgHIJKLMNOPQRST AbCDEFGHIJkLMNOPqRST AbCDEFGhIJkLMNOPqRST ABCDEfGHIJKLMNOPQRST aBCDEFgHIJKLMNOPQrST aBCDEFgHIJKLMnOPQrST History
b bq bqk bqkh g ga gar garn f ABCDEFGHIJKLMNOPQRST AbCDEFGHIJKLMNOPQRST ABCDEFgHIJKLMNOPQRST AbCDEFGHIJKLMNOPqRST aBCDEFgHIJKLMNOPQRST AbCDEFGHIJkLMNOPqRST AbCDEFGhIJkLMNOPqRST ABCDEfGHIJKLMNOPQRST aBCDEFgHIJKLMNOPQrST aBCDEFgHIJKLMnOPQrST Retention & amplification of only a few haplotypes
For any short region of DNA typically only 4-6 haplotypes are found in a sampling of present day humans (of the many millions that must have existed in at least one copy en route). These local haplotypes provide some information about ancestry. Now consider how the major haplotypes of each short region of DNA are associated with neighboring haplotypes to see where recombination events took place.
aBCDEFgHIJKLMnOPQrSTUVwXyZaBCDEFgHIJKLMnOPQrSTUVwXyZ aBCDEFgHIJKLMnOPQrSTUVwXyZ aBCDEFgHIJKLMnOPQrSTUVwXyZ aBCDEFgHIJKLMnOPQrSTUVwXyZ aBCDEFgHIJKLMnOPQrSTUVwXyZ aBCDEFgHIJKLMnOPQrSTUVwXyZ aBCDEFgHIJKLMnOPQrSTUVwXyZ High LD regions?
aBCDEFgHIJKLMnOPQrSTUVwXyZaBCDEFgHIJKLMnOPQrSTUVwXyZ aBCDEFgHIJKLMnOPQrSTUVwXyZ aBCDEFgHIJKLMnOPQrSTUVwXyZ aBCDEFgHIJKLMnOPQrSTUVwXyZ aBCDEFgHIJKLMnOPQrSTUVwXyZ aBCDEFgHIJKLMnOPQrSTUVwXyZ aBCDEFgHIJKLMnOPQrSTUVwXyZ High LD segment High LD segment Recombination hot-spot
85% of genome made up of 5-20kb high LD blocks Only 4-5 different major haplotypes per block in the world!