Download
1 / 15
150 likes | 211 Views
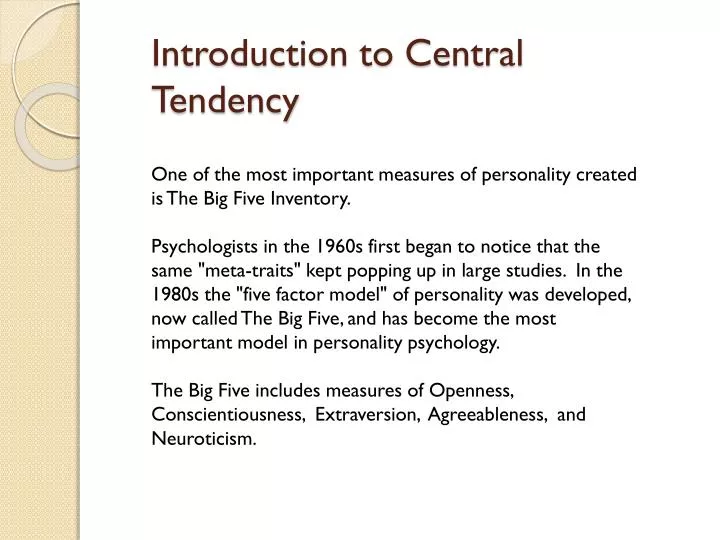
Introduction to Central Tendency. One of the most important measures of personality created is The Big Five Inventory.

E N D
Introduction to Central Tendency One of the most important measures of personality created is The Big Five Inventory. Psychologists in the 1960s first began to notice that the same "meta-traits" kept popping up in large studies. In the 1980s the "five factor model" of personality was developed, now called The Big Five, and has become the most important model in personality psychology. The Big Five includes measures of Openness, Conscientiousness, Extraversion, Agreeableness, and Neuroticism.
Introduction to Central Tendency To learn more about your personality profile I want to introduce you to a website Dr. Ravi Iyer and Dr. Ryan Howell created titled “BeyondThePurchase.Org” which allows individuals all over the world to take free psychology quizzes to find out more about their personality traits. Once you’ve completed The Big Five quiz, you’ll be able to view your results for each of the five dimensions, and compare those results to others.
Introduction to Central Tendency Suppose we wanted to know the average Extraversion score of students at a local university (i.e., what is the average level of extraversion at this university?). To know the population mean of students we would need to ask all 25,000 students at the university. Instead we estimate the population mean by recruiting a sample 10 students (using convenience sampling or opportunity sampling) to complete a brief measure of the five major personality dimensions.
Introduction to Central Tendency We will use question number 4 as an indicator of extraversion. Here are the scores from the 10 students: 5, 3, 3, 1, 4, 4, 1, 4, 2, 5
Introduction to Central Tendency We will use question number 4 as an indicator of extraversion. Here are the scores from the 10 students: 5, 3, 3, 1, 4, 4, 1, 4, 2, 5
Introduction to Central Tendency The mean of our sample is 3.2 Now, you can begin to think if your own score was higher or lower than 3.2. This helps you know if you score is above or below the sample mean of students (i.e., are you more or less extraverted than the 10 people in our sample?).
Introduction to Central Tendency That is one measure of central tendency. Another measure of central tendency is the median: The median is the midpoint of the scores in a distribution when they are listed in order from smallest to largest. The median divides the scores into two groups of equal size. The score that cuts the distribution in half. The score at the 50th percentile. The median is the score below which 50 percent of the area of any polygon is located. APA style: (Mdn= 4.50) A single value – may not be in the distribution of scores.
Introduction to Central Tendency How do we find the median? We start by computing the median location: Thelocation of the central value After scores are in ascending order, defined as (N + 1) / 2 = median location If we have 7 scores then the median is located at: (7 + 1) / 2 = 4thscore. If we have 6 scores then the median is located at: (6 + 1) / 2 = 3.5th score – halfway between the 3rd and 4th score. Now, let’s compute the median extraversion score from our sample of 10 students.
Introduction to Central Tendency First, arrange the data in numerical order: 1, 1, 2, 3, 3, 4, 4, 4, 5, 5. Find the median location (10 + 1) / 2 = 5.5 So the median is halfway between the 5th and 6thscore.
Introduction to Central Tendency Next, arrange the data in numerical order: 1, 1, 2, 3, 3, 4, 4, 4, 5, 5 To find the median, calculate the average of 3 (the 5th score) and 4 (the 6th score): (3 + 4) / 2 = 7 / 2 = 3.5 So, the median = 3.5
Introduction to Central Tendency Remember: Meanis the balance point of a distribution Defined by distances Often is not the midpoint of the scores Median is the midpoint of a distribution Defined by number of scores Often is not the balance point of the scores Both measure central tendency, using two different concepts of “middle”
Introduction to Central Tendency Now you’re able to write an interpretation of these data comparing the mean and the median: • On average, this university’s students’ (n = 10) extraversion scores were above the midpoint of the scale (M = 3.2); also, 50% of the students had scores at or below 3.5.