Download
1 / 28
290 likes | 430 Views
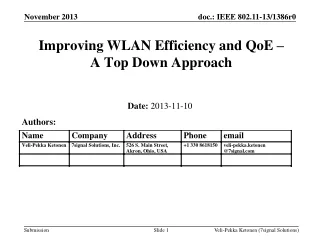
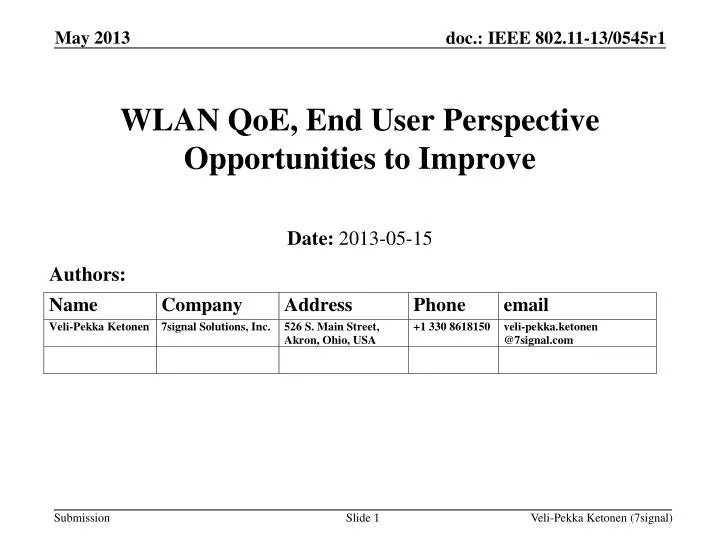
WLAN QoE, End User Perspective Opportunities to Improve. Date: 2013-05-15. Authors:. Abstract. Presentation for 802.11HEW SG in Hawaii May 12 th -17 th Interim meeting

E N D
WLAN QoE, End User PerspectiveOpportunities to Improve Date: 2013-05-15 Authors: Veli-Pekka Ketonen (7signal)
Abstract Presentation for 802.11HEW SG in Hawaii May 12th-17th Interim meeting Includes data from various anonymous networks from 7signal Sapphire automated client device QoE measurements for performance optimization and management work Bottlenecks in current networks and suggestions for improvements are presented as background for further HEW SG work Veli-Pekka Ketonen (7signal)
The Key Challenge Veli-Pekka Ketonen (7signal)
In live networks, high max performance does not translate to sufficient user experience* Capacity, range and end user experienced quality do not any more meet needs Example from University. Nw. vendor has less impact, network config. higher impact * = these are hourly average values from an area of multiple APs/SSID over a week time Veli-Pekka Ketonen (7signal)
Key findings Veli-Pekka Ketonen (7signal)
#1. Too aggressive rate control,average retrys often exceed 50% (1/2) • With 802.11n products, regularly 30-50% of packets require at least one retry. Often even more. Too high rate selected A lot of retries, multiplied by MIMO-X factor High utilization Lower SNR More radio retries, up to 7 times/packet No air time & lost packets Capacity and TCP throughput collapse Veli-Pekka Ketonen (7signal)
#1. Too aggressive rate control, less aggressive has been proven better (2/2) • Individual network behavior impacts also all other nearby networks • 802.11ac has much more demanding requirements than 802.11n • Suggestions: • Use clearly less aggressive rate control • Make rate control dynamic, adjusting based on observed radio conditions (like continuous Bluetooth) • 802.11 to specify proper rate control schemes, instead of leaving this to vendors Past findings from Nokia Networks EDGE link adaptation (Public, Ref [1]) RX-level during this part of the route: -70 – -88 dBm Original link adaptation Throughput RX-level Throughput Optimized link adaptation RX-level • -> Reason for improvement: • Using more MCS-8 instead of MCS-9 Veli-Pekka Ketonen (7signal)
#2 Automated channel control algorithms need clear improvements • Automated features, like channel selection do not work properly • Continuous channel hopping in the whole network and no stable state • Impacts also surrounding networks • Suggestion: • 802.11 to specify more in more detail requirements Veli-Pekka Ketonen (7signal)
#3. Already available radio settings are not utilized since their impacts are not understood • Radio should more accurately and dynamically operate its settings, like • Data rates; supported, default, control • Management/control traffic data rates, • Fragmentation process, MTU • QoS • Ack/block ack schemes usage • Long/short pre-amble configuration • RTS/CTS process • Supported 802.11 standards • Minimum limit for probe response • Load balancing, etc • Suggestions • Performance management practices • Automated operation • 802.11 to specify in more detail Veli-Pekka Ketonen (7signal)
#4. Interference due to lacking channel coordination and Bluetooth devices • Channel plans are almost random in public areas • Resulting packet loss, jitter • Proper radio operation in the mid-term still requires significantly better channel plans • Suggestions • Better, proven automated algorithms for channel negotiation • Cloud based control • Regulation for allowed channels • Better industry defaults • Adhoc channel selection limited/guided Veli-Pekka Ketonen (7signal)
#5. Too dense beacons load air unnecessarily • Suggestions • Define default beacon intervals longer, ~300ms • Dynamic/adaptive beaconing, beacon interval automatically dependent on the observed time between roaming. • Consider add few % variance to beacon intervals to avoid continuously repeating collisions (compare to spread spectrum CPU clocking for EMI reduction) • Consider impact to power save functionality In practice solely 100ms used globally with 1 Mbit/s as mandatory rate in consumer grade APs. This congests air significantly everywhere In 100ms, a person walking full speed moves ~10 inches (~ 25cm). Is this dense beaconing necessary? Veli-Pekka Ketonen (7signal)
#6. Mobile networks interfere 2.4 GHz band WLANs through 3rd harmonic distortion DCS-1800 (EUR, US) PCS-1900 (EUR) UMTS-1900 (US) UMTS-2100 (EUR) UMTS-1700 (US) WLAN Verified to happen in live network conditions High power mobile base station signal High power mobile base station signal WLAN signal => Harmonic distortion lands at 300MHz distance from source Distance appr. 300MHz => Signal-to-noise ratio degrades in WLAN receiver and data transfer suffers Ghost signal (noise) 1.7 GHz 1.8 GHz 1.9 GHz 2.0 GHz 2.1 GHz 2.2 GHz 2.3 GHz 2.4 GHz 2.5 GHz 2.6 GHz • When cellular network indoor antennas are near (30ft/10m) to WLAN APs and/or clients, they may saturate the receiver with off band signals and receiver generates distortion product that lands in the 2.4 GHz band • Suggestion • Add mandatory RF band-pass filtering to WLAN radios • Receiver blocking test to FCC approval Veli-Pekka Ketonen (7signal)
#7. Support for legacy devices (802.11b/a) seriously degrades benefits of new standards • Protection mode is “contagious” and highly inefficient • Benefits of new standards are limited if legacy devices are overprotected. Important especially in consumer grade equipment. • Suggestions • Better industry defaults • 802.11b not supported • 802.11a not supported • Improvements to protection mode • Prevent/limit protection mode spreading with required minimum signal levels Veli-Pekka Ketonen (7signal)
#8. Lacking interoperability may take down whole network performance • Suggestions • More exact requirements needed for client-AP interoperability • Live network performance management capabilities need to improve. All scenarios cannot ever be tested upfront. Introduction of new radio devices increased average retry rates to about 70%. Max network capacity came down at least 50% Veli-Pekka Ketonen (7signal)
#9. Modest access point antenna solutions • Omni-antennas with significant vertical coverage are widely used • RF energy goes where it should not go and antennas try to receive it from directions where are no clients • Lacking antenna sophistication • More gain towards users would benefit uplink quality • Lack of antenna directivity creates more interference • Suggestions • Down-tilt beam patterns • Fixed, “normal” antennas • Electrically adjustable, like in mobile networks • Wider use of beam steering Veli-Pekka Ketonen (7signal)
#10. Performance Management is completely missing • With WLAN networks, commonly accepted fact is that: “It is not necessary to continuously know what kind of service end users get from the network. If we manage to make it work once, there is no need to look after performance for several months/a year. It will take care of itself automatically. We will troubleshoot when end users complain” • This approach fundamentally prevents WLAN becoming a reliable media • Mobile operators/telecom industry are used to manage networks based on Meaningful Key Performance Indicators, KPIs, that accurately indicate and predict User Experience (L1-L7) in the network. These are covered also in standards. This is a good practice that should be brought to WLAN • Beyond technology providing the required solutions, dataand services, even bigger change is required in attitudes. Veli-Pekka Ketonen (7signal)
2-10x improvement available with these alreadyResults: Controller Automation vrs First Manual Optimization Round Veli-Pekka Ketonen (7signal.) Slide 17 • University campus, dense WLAN network • 2.4 GHz downlink throughput improvement Improvement • Area 1 7Mbit/s vrs. 25Mbit/s (+250%) • Area 2 5Mbit/s vrs. 15Mbit/s (+200%) • Area 3 8Mbit/s vrs. 16Mbit/s (+100%) • 2.4 GHz uplink throughput improvement • Area 1 7Mbit/s vrs. 20Mbit/s (+180%) • Area 2 10Mbit/s vrs. 25Mbit/s (+150%) • Area 3 12Mbit/s vrs. 20Mbit/s (+65%) • 2.4 GHz downlink Voice Quality (MOS grade, max 4.0) improvement • Area 1 2.6Mbit/s vrs. 3.5Mbit/s (+0.9 MOS) • Area 2 2.9Mbit/s vrs. 3.8Mbit/s (+0.9 MOS) • Area 3 2.5Mbit/s vrs. 3.5Mbit/s (+1.0 MOS) • 2.4 GHz uplink Voice Quality (MOS grade, max 4.0) improvement • Area 1 3.5Mbit/s vrs. 3.8Mbit/s (+0.3 MOS) • Area 2 3.5Mbit/s vrs. 3.9Mbit/s (+0.4 MOS) • Area 3 2.5Mbit/s vrs. 3.5Mbit/s (+1.0 MOS) • 2.4 GHz jitter daily averages before vrs. after • Area 1 9% vrs. 1% (- 89%) • Area 2 9% vrs. <<1% (> -90%) • Area 3 7% vrs. 1% (-85%) • Hourly minimum measured downlink throughput values increase 10X • Area1, Area 3 0.2 Mbit/s vrs. 2.5 Mbit/s (~1100%)
References [1] Nokia Networks/JussiNervola: Optimization of EGPRS Link Adaptation, 2007/01/16 • M.Sc. Thesis seminar presentation • http://www.netlab.tkk.fi/opetus/s38310/06-07/Kalvot%2006-07/nervola_160107.ppt Network statistics from 7signal network optimization and performance assurance reports Veli-Pekka Ketonen (7signal)
ADDITIONAL SUGGESTIONS Veli-Pekka Ketonen (7signal)
Other input for SG work Veli-Pekka Ketonen (7signal)
DATA COLLECTION BACKGROUND Veli-Pekka Ketonen (7signal)
Background • 7signal utilizes its products to optimize and operate critical WLANs (hospitals, universities, enterprises, manufacturing) • This process includes continuous collection and analysis of large amount of performance data, consisting of over 600 different metrics. Optimization takes place by reconfiguration and pre-emptive changes on network based on the data. • Data includes • Automated client device tests, providing L1-L7 data • Passive L1-L2 packet statistics of all 802.11 air traffic • RF environment data • Spectrum analysis data Veli-Pekka Ketonen (7signal)
7signal Sapphire consists of three elements One Eye unit manages 4-7access points (indoors) Sonar test servers are located in in close proximity to application servers Centrally located Carat manages Eyes, provides reports and alarms. Includes Analyzer software Radio analysis, radio packet capture and end-to-end application measurement • Alarm • Analyze • Troubleshoot • Verify • Monitor • Measure • Record • Report
7signal Sapphire data covers all layers 1-7 • Synthetic tests (L1-L7) • FTP, PING, HTTP, DHCP, SIP, VOIP • Association/authentication/IP address/test success rates, delays, throughput, latency, jitter, packet loss, MOS, data rates, failure codes • 60 performance indicators, separately for each AP/SSID/Sonar pair • Spectrum analysis (L1) • High resolution (280kHz) spectrum analysis for ISM band • Historical data over months, interference source analysis with beam steering, compass direction data on beams • RF analysis (L1-L2) • Access point settings and capabilities, signal levels, channels, noise levels • 40 performance indicators, separately for each AP, channel, antenna beam • Troubleshooting tests (L1-L7) • Remote, manual process for troubleshooting purposes • Full array of tests may be scheduled manually to each Eye • Eyes may be assigned to perform the additional tests without interrupting automated monitoring process • Traffic analysis (L2) • Radio frame header analysis for traffic flow between clients and access points • Data rates, retry rates, air congestion, roaming, frame size, device vendor, statistics for all 802.11 frame types, reason codes and status codes • 500 performance indicators, separately for each client, SSID, AP, band, antenna beam • Full packet capture (L1-L2) • Remote, manual process for troubleshooting • Full blown remote packet capture and easy export to packet level analyzer like Wireshark, in case individual radio packet header content information is needed • Eyes may be assigned to perform the test without interrupting automated monitoring process
7signal Sapphire Eye, the data collection device • A “turbo charged” client device • At times active like end users, at times fully passive • Beam steering technology with low noise amplifiers • Integrated compass • 802.11 a/b/g/n support • High resolution ISM band spectrum analyzer • High RF performance design; maximized coverage, minimized quantity, typically 4-7 AP’s per unit • Standard PoE • Neutral design and white color • Attaches easily to ceiling grid, alternatively wall or pole • Indoor and outdoor versions • Data analyzed at device, only key results to database • Minimal load to network, small test packets at determined intervals
7signal view on QoS, similar to end users WLAN radio Network LAN wired network Site broadband connection Core switching network End user terminals Application servers 300x 7signal Sonar software 900x 2x Radio network and spectrum analysis 200x 100x End user device quality of service in radio network Access Point 200x Servers 100x Core Router 10x Radio communcation at 2.4/5 GHz frequencies LAN switch 100x 5x 8x 100x WLAN controller Core switch Server racks Active end-to-end quality of service assessment from end user perspective 7signal Eyes