Download
1 / 20
240 likes | 456 Views
An Overview of the Williams Fork Formation Reservoir Characterization at Mamm Creek Field, Piceance Basin, Colorado Matthew J. Pranter , Alicia Hewlett, Sait Baytok , Rachel Shaak. University of Colorado at Boulder. Outline. Research Objectives Study Area

E N D
An Overview of the Williams Fork Formation Reservoir Characterization at Mamm Creek Field, Piceance Basin, Colorado Matthew J. Pranter, Alicia Hewlett, SaitBaytok, Rachel Shaak University of Colorado at Boulder
Outline Research Objectives Study Area 3-D Reservoir Characterization and Modeling of Matrix Properties Seismic Interpretation, Fracture Analysis, and Fracture Modeling Conclusions
Research Objectives • Within the southeastern Piceance Basin and Mamm Creek Field, how does the lower Williams Fork Formation vary in terms of stratigraphic architecture, shoreline stacking patterns, and lithology? • For the Williams Fork Formation at Mamm Creek Field, what is the stratigraphic variability of sandstone-body type and distribution, matrix reservoir quality, and static connectivity? • For the Williams Fork Formation at Mamm Creek Field, what are the main fault types and their distribution and how does fracture distribution vary with faulting, lithology, architectural elements and other parameters?
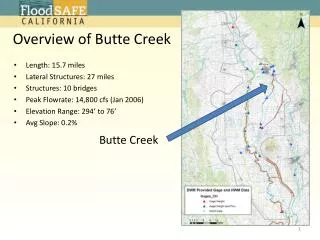
Study Area and Focus Regional distribution of coastal plain and marine deposits Fracture intensity and seismic attributes 3-D reservoir modeling of tight-gas sandstones Discrete fracture network modeling N 3-D seismic analysis of fault and fracture distribution
Study Area and Focus Measured Section Reservoir Model Area Seismic Survey • data from 1,400 wells • 3-D seismic survey • 8 cores • 12 borehole image logs • outcrop sandstone-body statistics • measured section Image Logs Cores
Reservoir Characterization and Modeling 2 mi2 91 wells irregular 10-acre density
Stratigraphic Intervalfor Reservoir Modeling Stratigraphic Intervalfor Reservoir Modeling (~2200 ft) Coastal /Alluvial Plain Shoreface/Deltaic Marsh, Mire, Swamp, and Estuarine Marine Shelf/Ramp Modified from Carroll and others (2004); Cole and Pranter (2008)
Model Framework Upper Williams Fork Formation Middle Williams Fork Formation V.E. = 1X Lower Williams Fork Formation Paonia Sh. Mbr. • 91 wells • 15 zones • 40’ x 40’ x 1’ • 89.4 million cells Upper Ss. Middle Ss. Cameo Rollins V.E. = 4X
Model Inputs and Constraints Calculated Lithology logs Interpreted Architectural Element Logs crevasse splay sandstone/ clean sandstone shaley sandstone point bar Variography Outcrop dimensional statistics and object shapes Experimental Variogram Variogram Map Azimuth: 39˚
Architectural Element Object Shapes Channel Bar / Point Bar Crevasse Splay
Vertical Constraint:Vertical Proportion Curves Architectural elements Basic Lithology Refined Lithology 0 0.2 0.4 0.6 0.8 1 0 0.2 0.4 0.6 0.8 1 0 0.2 0.4 0.6 0.8 1 Upper Williams Fork Middle Williams Fork Lower Williams Fork (Paonia) Upper sandstone Middle sandstone Cameo-Wheeler Top Rollins
3-D Spatial Constraint: Seismic Probability Volume Middle Williams Fork Middle Sandstone Provided by iReservoir.com
3-D Lithology Modeling and3-D Architectural-Element Modeling • Sequential-indicator simulation (SIS) of basic lithology • Sandstone, mudstone, coal modeled • With 3-D seismic-based spatial probability constraint • Sequential-indicator simulation (SIS) of refined lithology • Clean sandstone, shaley sandstone, mudstone, and coal modeled • Object-based simulation constrained to lithology • Constrained to outcrop dimensional statistics for fluvial architectural elements (Pranter et al., 2009) • Object-based simulation constrained to architectural elements • Constrained to outcrop dimensional statistics for fluvial architectural elements (Pranter et al., 2009)
Modeling Examples Basic Lithology w/ 3-D seismic constraint Refined Lithology Basic Lithology Basic Lithology Refined Lithology Architectural Elements
Future Modeling work • Petrophysical modeling • Porosity • Permeability (conventional core data) • Channel cluster analysis • Static sandstone-body connectivity
3-D Seismic Interpretation Uninterpreted Interpreted vertical slices through seismic data (amplitude) Depth slice through ant tracking volume without interpretation Depth slice through ant tracking volume with interpreted faults Noise on survey edge
3-D Seismic Interpretation • Fault interpretation based on seismic amplitude, ant-tracking results, and curvature attributes • Two near-vertical fault sets (shallow faults strike N60W; deep faults strike N45E) Uninterpreted Interpreted N N Deep Faults Middle Sandstone
3-D Seismic Interpretation • Fault interpretation based on seismic amplitude, ant-tracking results, and curvature attributes • Two near-vertical fault sets (shallow faults strike N60W; deep faults strike N45E) Uninterpreted Interpreted Shallow Faults N N Top Mesaverde Group
Fracture / Seismic Attribute Analysis Relationship between ant tracked seismic attribute and fracture intensity in fractured zones Fractured Zone Correlation coefficient: 0.73 Ant-tracking Attribute Upscaled Fracture Intensity
Fracture Analysis and DFN Modeling Fracture Dip Angle and Dip Azimuth Fracture Intensity and Lithology + DFN (discrete fracture network) model Ki Scale up fracture properties Kj Kk