Download
1 / 6
60 likes | 212 Views
Time-Dep Cov Approach. Divide time into a series of periods: e.g., Year 0-1, 1-3, 3-5, 5+. 1. Time-Dep Cov Approach. Divide time into a series of periods: e.g., Year 0-1, 1-3, 3-5, 5+. The trick here is that the time interval itself becomes the time varying covariate!. 2.

E N D
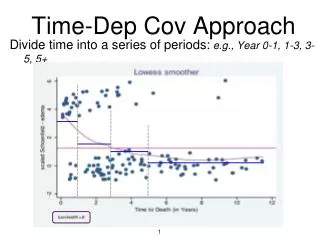
Time-Dep Cov Approach Divide time into a series of periods: e.g., Year 0-1, 1-3, 3-5, 5+ 1
Time-Dep Cov Approach Divide time into a series of periods: e.g., Year 0-1, 1-3, 3-5, 5+ The trick here is that the time interval itself becomes the time varying covariate! 2
Time-Dep Cov Approach • Divide time into a series of periods (e.g., Year 0-1, 1-3, 3-5, 5+) • Estimate HR for edema for each period • Acheived by creating a series of TD covariates: edema01, edema13, edema35, edema5p that separately give the effect of edema in each periods stset years, failure(status) id(number) // generates _t0, _t, _d stsplit grp, at(1 3 5) // split time variable (years) at these times into groups ≤ years (grp) // that is, generate multiple rows for each subject; one for each timepoint up to and including // the time of censoring or time of death recode status .=0 // recodes all newly generated rows to “censored” status list number _t0_tstatus age edema grp in 1/15, sepby(number) // lists values of the variables: number _t0 _t status age edema grp // “in 1/15” restricts to first 15 rows; “sepby(number)” draws line between each subject gen edema01=edema*(grp==0) // This set of commands generates 4 separate gen edema13=edema*(grp==1) // edema variables specific to each time interval; gen edema35=edema*(grp==3) // that is, edemaXX only equals 1 if the patient has edema gen edema5p=edema*(grp==5) // AND the dataset row corresponds to period XX 3
TD Cov Set-Up . list number _t0 _t status edema grp edema01 edema13 edema35 edema5p in 1/12, sepby(number) +-------------------------------------------------------------------------------------------+ | number _t0 _t status edema grp edema01 edema13 edema35 edema5p | |-------------------------------------------------------------------------------------------| 1. | 1 0 1 Censored 1 0 1 0 0 0 | 2. | 1 1 1.0951403 Dead 1 1 0 1 0 0 | |-------------------------------------------------------------------------------------------| 3. | 2 0 1 Censored 0 0 0 0 0 0 | 4. | 2 1 3 Censored 0 1 0 0 0 0 | 5. | 2 3 5 Censored 0 3 0 0 0 0 | 6. | 2 5 12.320329 Censored 0 5 0 0 0 0 | |-------------------------------------------------------------------------------------------| 7. | 3 0 1 Censored 1 0 1 0 0 0 | 8. | 3 1 2.770705 Dead 1 1 0 1 0 0 | |-------------------------------------------------------------------------------------------| 9. | 4 0 1 Censored 1 0 1 0 0 0 | 10. | 4 1 3 Censored 1 1 0 1 0 0 | 11. | 4 3 5 Censored 1 3 0 0 1 0 | 12. | 4 5 5.2703629 Dead 1 5 0 0 0 1 | +-------------------------------------------------------------------------------------------+ A separate edema variable is set up for each time period so that we can have hazard ratio estimates for edema specific to each time interval!! 4
Output gen age10=age/10 stcox edema?? age10 No. of subjects = 312 Number of obs = 1001 No. of failures = 125 Time at risk = 1713.853528 LR chi2(5) = 69.23 Log likelihood = -605.36554 Prob > chi2 = 0.0000 ------------------------------------------------------------------------------ _t | Haz. Ratio Std. Err. z P>|z| [95% Conf. Interval] -------------+---------------------------------------------------------------- edema01 | 14.45344 6.974774 5.53 0.000 5.613169 37.21639 edema13 | 3.423855 1.241054 3.40 0.001 1.682588 6.967111 edema35 | 3.187902 1.495416 2.47 0.013 1.2712 7.994587 edema5p | .8742166 .526164 -0.22 0.823 .2687244 2.844009 age10 | 1.33777 .1153185 3.38 0.001 1.129812 1.584006 ------------------------------------------------------------------------------ HR declines with time, does not significantly differ from 1 after year 5 5
Verbage “Adjusted for age, during the first year of follow-up, subjects with edema at baseline have about 14-fold (5.6-37) higher hazard of death. During years 1-3 and 3-5, it is 3.4-fold (1.7, 7.0) and 3.2-fold (1.3, 8.0) higher respectively compared to those with no edema. After year 5, the relative hazard is 0.87 (0.3, 2.8), not significantly different from 1.0.” 6