Download
1 / 23
230 likes | 339 Views
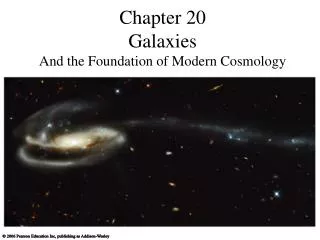
Full Spectral Analysis of Galaxies - Are we there yet?. Ben Panter, Edinburgh bdp@roe.ac.uk. =. +. +. Full Spectral Analysis?. Emission lines give information on current star formation, but tell us nothing about the history. Good for redshifts too!.

E N D
Full Spectral Analysis of Galaxies - Are we there yet? Ben Panter, Edinburgh bdp@roe.ac.uk
= + + Full Spectral Analysis? Emission lines give information on current star formation, but tell us nothing about the history. Good for redshifts too! Continuum shape can reveal generics of populations, and perhaps a mass to light ratio. Spectral features can help reveal the average metallicity when stars formed, and perhaps their mean age
Pixels vs. Parameters Models 3000 pixels Comparison Method Observations Need a clever way to perform this analysis for any non-trivial parameterisation
How does MOPED solve this? Massively Optimized Parameter Estimation and Data Compression Short version: • Pick the pixels which tell you most about the parameters you wish to extract from the data • Create a weighting vector, b, for each parameter which gives a projection y (scalar) of the dataset x. • ym=bm.x • If model is good, then these y numbers encapsulate all the information about the parameters – the compression is lossless • Can use these y values to determine likelihood of a parameter set, rather than x – hence computation time µ nparams not npixels Long version: Heavens et al. 2000, Reichardt et al. 2001, Panter 2005.
Not the only show in town… MOPED (Panter 03) MOPED2 (Mathis 06) BLV (Nolan 06) STARLIGHT (Cid Fernandez 05) VEPSA (Tojeiro 07) STECMAP (Ocvirk 03)
z z So why bother? High redshift sources • Limited to bright galaxies • Subject to IMF (high end) • Dependent on models • Uncertain dust correction Low redshift sources • Subject to IMF (low end) • Dependence on models • Dust correction easier to manage • Many, many more galaxies...
Downsizing Downsizing
Metallicity History Maps Preliminary result, please do not redistribute
So are we there yet? Lots of results that reassuringly agree with other indicators Lots of information still to be untangled…
Missing Ingredients: Alpha enhancement Models available Variable abundances Infancy UV Continuum IR Continuum Need to separate… Looking at the models Models Comparison Method Observations
How can we differentiate features? • Two groups of high signal to noise galaxies: • Telescope features fixed in observed frame, Modelling features fixed in rest frame. • Very tight redshift range for clear observed frame (W) • Wider range of redshift to smooth observed frame (T) • Subtract residuals of W from T
Where do the models fail? Average Tight z Wide z T - W
Incorporating Alpha Preliminary result, please do not redistribute Panter / Coelho in prep.
Modelling all the way - UV to IR Nolan et al. 06
Future Surveys – what is needed? • S/N in sloan is good, but other problems appear to dominate • Spectrophotometry • Redshift range • Moderately higher redshift helps a lot • Database methods essential • GAVO Models Comparison Method Observations
2SLAQ/DEEP2/GDDS/GOODS... Higher redshift allows us to probe early epoch populations High z SF from mid-z sources Present data does not support reliable analysis (?)
Wish list for higher z FSA • Resolution of ~ 1A • UV + Visible + IR with overlap • SDSS or better S/N • 10,000 galaxy spectra • z ~ 1 • Accurate calibration of spectrophotometry • Better than sloan?
Methods are in place and tested Models need Wider range at high res (observations!) / Var. Abundances Uniform format Data needed Moderately higher z Spectrophotometry (more important than numbers?) Conclusions Models Comparison Method Observations