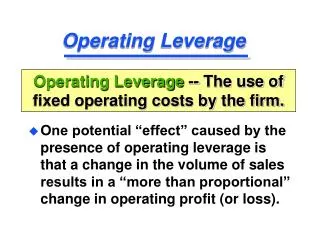
Download
1 / 90
950 likes | 1.41k Views
The Leverage Cycle. John Geanakoplos. Two Themes. Central Banks should monitor and regulate leverage , not just interest rates. Must measure leverage properly New Modeling Techniques Agent Based Models Collateral Equilibrium Leverage Cycle Told as a personal narrative.

E N D
The Leverage Cycle John Geanakoplos
Two Themes • Central Banks should monitor and regulate leverage, not just interest rates. • Must measure leverage properly • New Modeling Techniques • Agent Based Models • Collateral Equilibrium • Leverage Cycle Told as a personal narrative
My Mortgage Experience • Kidder Peabody (1865-1994) • 1989-90 mathematical visitor • 1990-94 head of fixed income research • 1994 crash • Ellington Capital Management • 1995- boom • 1998 crash • 1999 boom • 2007-2008 crash • 2009 boom • Still going
I. Securitization Giant Pools of Mortgages Backing Securities 1970s and 1980s Then Tranched into Contingent Securities 1986 -
MORTGAGEMARKET Investors CMO Derivative CMO CMO CMO Contingent Promises Contingent Promises CMO Collateral Pass-Through Pools Mortgages Mortgages Sells Promises Sells Promises MBS Hierarchy Collateral Floater Inverse Floater Prepayment Risk Fannie Freddie Conforming Loans
Kidder Peabody • Dominated CMO market 1990-1995 • Over 20% of all issuance • Issued $1 trillion of CMOs • Strategy was to line up buyer for most dangerous, derivative piece, then go ahead and buy pool, before waiting to get all other pieces sold off. • Got best sales people. • Had to hold huge inventory. • Needed models of cash flows.
II. Predicting Prepayments via Agent Based Models • States of the World • Conditional Predictions • Rationality?
Exogenous State Space • Leibnitz (Possible Worlds) • States include paths of interest rates • States include paths of future home prices • We do not feel we can predict interest rates or housing prices • We make prepayment predictions conditional on state of the world
Historical Prepayments Have 30 years of data on fairly stable group of conforming homeowners Note lack of rationality, but sensitivity to interest rates, and burnout
Standard Model: Regression to Fit Parameters of Aggregate Curve • Only need to predict aggregate prepayment on giant pools with diversified loans • Clearly prepayments increase as new interest rate falls below original (fixed) mortgage rate • As pool is exposed to same prepayment opportunity, get burnout. • So estimated S-curve that depends on interest rate differential and on how long exposed.
Agent Based Model • Each agent type optimizes prepayment, with constraints • Estimate distribution of types, not behavior • Evolution of behavior as distribution of types changes • Deviations from Rationality: Agent Types Differ in • Cost • Alertness • Evolution of Deviations from Rational Prepayments • Smart Factor • Contagion (Media Effect)
Conditional Prepayment Projections can be very reliable Conditional Prepayment Projections Can Be Very Reliable
III. Economic Theory, Significance for Economy:A. Welfare • Reduced mortgage interest rate (relative to Treasuries) by at least 1% and standardized it across the country • But whole market invisible to the public
B. Collateral Equilibrium Paper 1997 • Purpose of financial system: create contingent contracts with guarantee to deliver • Scarce collateral • Stretching collateral: equilibrium collateral • Pyramiding • Tranching • Equilibrium Leverage • Equilibrium Default
My Mortgage Experience: The First Bust and Boom • Kidder Peabody (1865-1994) • 1989-90 mathematical visitor • 1990-94 head of fixed income research • 1994 crash: thought it was just Joe Jett scandal • Ellington Capital Management • 1995- • 1998 crash • 1999 boom • 2007-2008 crash • 2009 boom • Still going
MORTGAGEMARKET Investors CMO Derivative CMO CMO CMO Contingent Promises Contingent Promises CMO Collateral Pass-Through Pools Mortgages Mortgages Sells Promises Sells Promises MBS Hierarchy Collateral Hedge Fund Floater Inverse Floater Prepayment Risk Fannie Freddie Conforming Loans
My Mortgage Experience: A Second Boom and Bust • Kidder Peabody (1865-1994) • 1989-90 mathematical visitor • 1990-94 head of fixed income research • 1994 crash • Ellington Capital Management • 1995- boom • 1998 crash • 1999 boom • 2007-2008 crash • 2009 boom • Still going
Leverage Cycle Paper 2003 • Leverage goes up and prices go up • Leverage goes down, prices go down • Booms and busts • Even if people are rational forward looking agents. • Mortgage market a big part of the economy. This could happen on bigger scale. • May be bad for the economy
My Mortgage Experience: The third boom and bust proves the rule • Kidder Peabody (1865-1994) • 1989-90 mathematical visitor • 1990-94 head of fixed income research • 1994 crash • Ellington Capital Management • 1995- • 1998 crash • 1999 boom • 2007-2008 crash • 2009 boom • Still going
Bonds Subprime Secuirtization AAA CDS Loans CDS-AAA AA CDS-AA A CDS-A BBB CDS-BBB OC + Residual = 8% Protection 25% x 25% = 6.25% < 8% 70% prepay by third year 30% x50% x 50% = 6.75% < 8% OC Residual
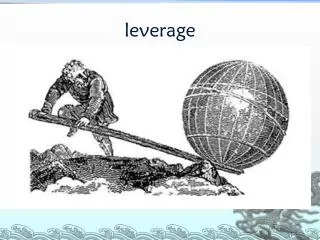
Shakespeare got this Right 400 years ago. The Merchant of Venice Who can remember the interest rate Shylock charged Antonio and Bassanio?
Leverage Cycle Papers • Geanakoplos 1997 “Promises Promises” • Geanakoplos 2003 “Liquidity, Default, and Crashes: Endogenous Contracts in General Equilibrium”. Invited address World Congress 2000. • Fostel-Geanakoplos 2008 “Leverage Cycles and the Anxious Economy”. AER. • Geanakoplos 2009 Macro Annual “The Leverage Cycle” • Geanakoplos 2010 “Managing the Leverage Cycle” NYFed Economic Policy Review • Thurner, Farmer, Geanakoplos 2009 “Leverage Causes Fat Tails and Clustered Volatility”
Early Collateral Papers • Bernanke-Gertler-Gilchrist 1996, 1999 • Kiyotaki-Moore 1997 • Geanakoplos-Zame 1997, 2002, 2005, 2009 • But these ignored changes in leverage.
Recent Leverage Papers • Brunnermeier-Pedersen (2009) • Gorton-Metrick (2009) • Adrian-Shin (2009) • Simsek (2010) • Cao (2010) • Krishnamurthy (2010) • Acharya -
Definition of Securities Leverage • Collateral = Asset put up as guarantee of loan. Often a house. I will assume no-recourse loans, like housing. • If can use $100 house to borrow $80, then: • margin or down-payment or haircut is 20%, LTV is 80%, leverage is 5. • Should measure all on new loans. • Very different from debt/equity investor leverage.
Equilibrium Leverage Standard Economic Theory: Equilibrium (supply = demand) determines interest rate. In my theory: Equilibrium determines Leverage as well. Surprising that one equation can determine two variables. In standard theory either ignore default (hence need for Collateral) or fix leverage at some constant.
What Determines Leverage • Interest rates determined by impatience. • Leverage determined by uncertainty about and disagreement over future collateral prices. Volatility is crucial. • In long run financial innovation increases leverage, e.g. by creating tranching and pyramiding
Why Leverage is important • As every trader knows, if leverage is 5, and asset moves by 1%, your return moves by 5%. If house price is $101, sell it, return $80 and make $1 on $20 = 5%. • No-recourse collateral gives borrower the “put option” to walk away from the house. House falls in value to $0, borrower walks away and loses only $20 even though lender loses $80. • Pundits say these two effects of leverage had big effect on crisis. My theory also includes these two effects. • But real significance of leverage in my theory is that it allows just a few investors to buy so many assets, and so explains bubbles.
More Leverage → Higher Asset PricesLow Leverage → Lower Asset Prices • Leverage gives optimists more buying power. • Relies on no short sales.
Natural Buyers Theory of Price Natural buyers public
Heterogeneous Agents • Natural Buyers vs Public • Differ in risk tolerance. • Differ in ability to hedge. • Differ in sophistication and knowledge. • Might use assets for production. • Might get higher utility for holding assets • Like houses • Leads to equilibrium leverage giving default • Or just more optimistic (different priors) • Leads to equilibrium leverage without default, like Repo market.
Standard Theory • Asset Price = Fundamental Value • Efficient markets hypothesis • Heterogeneity is missing.
Leverage Cycle • Too much equilibrium leverage in normal times • Too highassetprices in normal times • Too little leverage in crisis • Too low asset prices in crisis • Recurring cyclical problem.
Leverage Cycle Crashes Always Have same three aspects • Scary Bad news creating more uncertainty and more disagreement = high volatility • E.g. about FORECLOSURES • De-leveraging because nervous lenders ask for more collateral • Leveraged buyers (optimists) crushed, some go bankrupt, others insolvent and functioning poorly
Aftermath of Crash • Aftermath of crash is period of uncertainty about who will go bankrupt. • Aftermath duration depends on how big the cycle was and how effective government intervention is.
Rationality vs Irrationality • Leverage Cycle happens even if (partly because) all agents are perfectly rational. In model following agents are all rational. • Gets even worse if people irrationally pursue returns in exuberant phase by overleveraging without recognizing own risk, or if investors panic in crisis stage and sell.
Example of Leverage Cycle (2003) h = 1 Natural buyers = optimists Public = pessimists h = 0
Marginal buyer = .87. UU 1 h U h 1 .95 1 – h 1 UD 0 DU 1 h .69 1 – h D 1 – h .2 Crash really bad; news not. Top 13% of buyers go bankrupt. DD Leverage at 0 = .95/.26 = 3.6; Leverage at D = .69/.49 = 1.4 Interest rates = 0.
h=.87 Natural Buyers-Margins Theory of Crashes h=1 optimists At date 0 public h=0
h=.87 h=.61 x new optimists At state D pessimists h=0
Recurring Leverage Cycles • 1994 derivatives crisis, bankrupted Orange County • 1998 emerging markets and mortgages, bankrupted Long Term Capital • 2007-9 mortgage crash
Leverage dramatically increased from 1999-2006 • A bank that wanted to buy a AAA mortgage security could borrow 98.4% of purchase price, paying down only 1.6% cash. That’s over 60 to 1 leverage. • Average leverage in 2006 across all $2.5 trillion of toxic mortgage securities was 16 to 1. • So buyers only had to pay $150 billion cash, and borrow $2.35 trillion! • Home buyers could get mortgage with 3% down in 2006, for leverage 33 to 1.