Download
1 / 45
450 likes | 532 Views
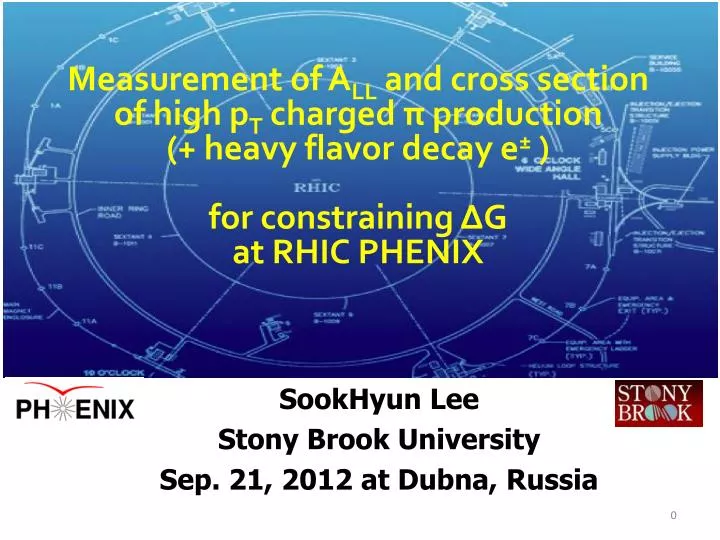
Measurement of A LL and cross section of high p T charged π production (+ heavy flavor decay e ± ) for constraining ΔG at RHIC PHENIX. SookHyun Lee Stony Brook University Sep. 21, 2012 at Dubna, Russia . Introduction. ΔG has been measured at various experiments.

E N D
Measurement of ALL and cross section • of high pT chargedπ production • (+ heavy flavor decay e± ) • for constraining ΔG • at RHIC PHENIX SookHyun Lee Stony Brook University Sep. 21, 2012 at Dubna, Russia
Introduction • ΔG has been measured at various experiments. • pDIS fixed target experiment • Inclusive measurements of g1 (Indirect measurements solely dependent on scale evolution ) • Less inclusive measurements of open charm & high pThadron pairs at COMPASS and HERMES (Direct access to gluon via γ-g fusion ) • p+p experiment at RHIC is yet another independent venue for ΔG with capabilities of directly accessing gluons. Jaffe, Manohar SPIN 2012 in Dubna, Russia
Probing polarized gluon distribution with single inclusive production • Observable • ++: same sign helicity of incoming protons • +−: opposite sign helicity of incoming protons This talk: π± , Heavy flavor e± † For mid-rapidity detectors at √s =200GeV SPIN 2012 in Dubna, Russia
π± and Δg • π± charge asymmetry is sensitive to sign of Δg(x, Q2) : • Duπ+ >Duπ0 >Duπ- , Δu>0 • Ddπ+ <Ddπ0 <Ddπ- , Δd<0 For positive Δg : Aπ+LL >Aπ0LL >Aπ-LL DSSV PRD80:034030(2009) SPIN 2012 in Dubna, Russia
Heavy Flavor decay e± • RHIC spin collaboration is also gearing its efforts to reaching smaller xg region. • While forward π0 measurements are under way on one side, PHENIX recently (a week ago!) published results on heavy flavor decay electron measurements to this end. • Open c and b decay electrons are dominantly from g-g scattering. Subprocess fraction at NLO open b and c arXiv : 0911.2146 SPIN 2012 in Dubna, Russia
PHENIX Cental Arm (2009) • Acceptance: • |η|<0.35, Δφ = 2 x π/2 • π0, η, γ measurement • Electromagnetic Calorimeter (PbSc/PbGl) as highpTphoton trigger • h± and e± • Hadron Blind Detector(HBD) for PID and tracking • Drift Chamber (DC) and • Pad Chambers (PC) for tracking • Ring Imaging Cherenkov Detector (RICH) for PID • jjj SPIN 2012 in Dubna, Russia
Hadron Blind Detector • Basic info • Cerenkov detector with CF4 gas • Entrance window at 5cm from beam pipe • Radiator extends upto ~60cm, coupled with Triple GEM (Gas Electron Multiplier) photon detector at end without windows • Status in 2009 (Taken out since 2011) • 10 (5sectors × [N+S]) modules (out of 12) installed in each arm. • Kinematic coverage ofΔφ = 2×112.5°, |η|<0.5 SPIN 2012 in Dubna, Russia
Why Hadron Blind Detector?HBD and charged particles • Original purpose of this detector: • Precision spectroscopy of vector mesons • Angular resolution designed to distinguish photonic background (small opening angle) from signals • Radiation thresholds for charged particles: • pT > 0.01(e±), 4(π±), 14(K±) GeV/c • Efficiency on the rise for π± in the pT range of 5< pT <13 GeV/c SPIN 2012 in Dubna, Russia
Detector response to π± andBackground rejection with HBD • Charge distribution fitted to a statistical model distribution for photo-multiplication (folded Polya function) • Scintillation background component and signal components fairly distinctive • The rising mean number of primary electrons for π± well described by radiation intensity • Very effective background rejection : mostly photo-conversion, off vertex meson (Kaons) decays. Residual background <2% • High reconstruction efficiency ~95% Red: Total, Blue: Scintillation background Green: π± candidtes SPIN 2012 in Dubna, Russia
Invariant (pT, y differential) cross section measurements • Motivations • Validation of pQCD framework with both un-polarized Parton Distribution Functions and Fragmentation Functions at the kinematic range of interest. • Especially fragmentation functions are direct inputs for ALL prediction and can be only constrained by specific particle production. • Data set : 2009 EMCal triggered data • Integrated luminosity : 11.8 pb-1 • Challenges • Trigger efficiency determination • RICH efficiency determination (efficiency again on the rise in the pT region ofπ± analysis (pT > 4.7 GeV/c) SPIN 2012 in Dubna, Russia
Track reconstruction efficiency for RICH and EMCal trigger efficiencies RICH efficiency Measured From Data Driven Method • Left: Raw pTspectra of π± • Center: RICH (Cerenkov detector) efficiency measured from data • Right: Reconstructed yield EMCal trigger efficiency Measured From Data by removing bias. SPIN 2012 in Dubna, Russia
NEW Results on high pTπ± cross section SPIN 2012 in Dubna, Russia
Comparisons with other results SPIN 2012 in Dubna, Russia
NEW Results on charge ratio of high pTπ± cross section • Charge separated fragmentation functions are not well constrained in DSS FFs. • In good agreement with recent STAR measurements (from 2005 data) • Results need to be incorporated into global analysis in order to get correct ALL prediction. SPIN 2012 in Dubna, Russia
ALL asymmetries & what comes next • pT range of this analysis covers <xg>~0.1 • Preliminary results do not use HBD, results from using HBD and their impact will be published soon! SPIN 2012 in Dubna, Russia
Results on heavy flavor decay electron cross section and ALL NEW • This results largely benefited from using HBD in elliminating photo-conversion and Dalitz decay background. • Decay electrons include J/ψ , bottom production and other vector meson as well as open charm contributions. arXiv:1209.3278 SPIN 2012 in Dubna, Russia
Open charm decay electrons and their constraints on Δ G • Open charm production dominates in pTrange of 0.50 < pT < 1.25 GeV/c(J/ψ <2%, b quark<5%) • pQCD prediction for ALLopen charm obtained from CTEQ6M PDFs + PYTHYA + LO hard scattering cross section • ALLopen charm ~|∆g/g(x, µ)|2 • |∆g(x, µ)| = C g(x, µ) is assumed • Results: • |∆g/g(⟨logx⟩,µ)|2 <3.3 ×10 −2 (1σ) and 10.9 ×10 −2 (3σ) SPIN 2012 in Dubna, Russia
Summary • Precision measurements of π0 and cross check with other independent channels remain crucial program at RICH PHENIX. • Recent cross section and ALL measurements with π± and heavy flavor decay have deepened understanding of each particle’s interaction with detectors. • PHENIX and STAR π± cross section results call for incorporating these results into global analysis SPIN 2012 in Dubna, Russia
Backup SPIN 2012 in Dubna, Russia
Clustering algorithm • Searching : • The Charged track projection scheme uses the Central arm tracking information on π± candidates. • HBD charge hits are found within a given “searching radius”. • Units : • The “Pad charge” is the smallest unit to quantify collected HBD charge. • A “Triplet” is composed of three neighboring pads with HBD charge above the threshold. • Cluster formation : • Various studies show that the “Maximum triplet method” is the most suitable algorithm • In this method, the triplet with the maximum HBD chargeform a “Cluster”.
Reasons why ‘Maximum triplet method’ is preferable to other methods (I) • One can choose as large a searching radius as possible without compromising background rejection. • Clustering efficiencies increase with searching radius. • Mean cluster charge for background does not rise as searching radius becomes large.
Reasons why ‘Maximum triplet method’ is preferable to other methods (II) • Separation between signal (π±) and background cluster is clear. • Fact: The chances of BG(background) triplet falling within searching radius along with SG(signal) triplet varies dramatically with searching radius. • Each cluster is either BG triplet or SG triplet, not a convoluted mixture of the two. • Background cluster densities do not depend on searching radius. • Signal cluster mean charge estimated from pure Monte Carlo is in good agreement with one from embedding. PLHF PWG
Reasons why ‘Maximum triplet method’ is preferable to other methods (III) • Probabilistic model for HBD Cluster charge distribution • “Poisson PDF” describes the number of Cerenkov photons ( k ) given the expectation (λ). • “Polya PDF” describes the number of collected charge ( q ) given the mean ( q). • The number of charge collected after avalanche ( q ) given the mean number of Cerenkov photons (λ) is described by “Folded Polya distribution”. λ=5 λ=15 λ=25
Cluster charge distribution :Results of fitting data to folded Polya function Fit function : • First term is for π± tracks • [0] : gain correction, • [1] : scale factor, • [2] : mean number of photo-electrons, • [3] : lost charge correction • Second term is for background tracks • [4] : scale factor, • [5] : mean number of photo-electrons.
ERT 4x4c trigger efficiency Event type 3 Event type 1 Event type 2 ✗ ✗ ✗ ✗ ✗ ✗ Inclusive ERT triggered events Idea : in minimum bias events there are PLHF PWG ERT 4x4c unbiased events
ERT 4x4c trigger efficiency In each type of event, there is at least one track that triggered 4x4c which renders the rest of tracks in the sameevent “4x4c unbiased”. π± with HBD ✗ anythingwith ERT π± with HBD+ERT ✗ anythingwith ERT ERT 4x4c unbiased pi± events The following 2 types of events contain charged pions which are unbiased to 4x4c trigger. PLHF PWG
From >1 sector separation for PbSc... Overall efficiency is ~51% for PbSc ! See backup slide 63 for Pt dependence of inclusive spectrum shape. PLHF PWG
ERT 4x4c efficiency turn on for PbScat >1 sector/2 sector/arm separation p0: scale p1: shape p2: offset
Factorization of εgeoandεreco x εgeo t εreco • Geometrical acceptance correction is done by applying fiducial cuts assuming perfect reconstruction efficiencies. • Reconstruction efficiencies are calculated against clean sample with fiducial cuts applied.
An example with 3 detectors What I propose to measure: The ratio of number of reconstructed π tracks that pass the cuts of relevant detector (t) and π tracks with projection on the relevant detector. Actual tracks in reality ε1 ε2 ε3 0 1 1 1 1 1 1 0 1 1 1 0 0 1 1 1 1 1 … 1 1 1 1 0 1 0 0 1 0 1 0 1 0 1 … … 8 cases and their probability of happening. (1-ε1)(1-ε2)(1-ε3) = C000 (1-ε1)(1-ε2) ε3 = C001 (1-ε1) ε2 (1-ε3) = C010 ε1 (1-ε2)(1-ε3) = C100 (1-ε1) ε2 ε3 = C011 ε1 (1-ε2) ε3 = C101 ε1 ε2 (1-ε3) = C110 ε1 ε2 ε3 = C111 0 0 0 0 0 1 0 1 0 1 0 0 0 1 1 1 0 1 1 1 0 1 1 1 t n n : tracks with projection onto active area of each of ‘all’ detectors. forεreco
What this means is… An example : Let’s throw 10000 tracks into detectors with the following efficiencies. Detector 1 (ε1= 98% ) Detector 2 (ε2= 97% ) Detector 3 (ε3= 95% ) What I will end up measuring for ε3 is • The track reconstruction efficiency of each detector can be calculated independent of one another. (This is NOT a bootstrap method!) • The efficiencies of detectors not relevant are canceled between numerator and denominator! • This method is applicable to data as well as simulated tracks. • Examples will follow next and later in the discussion.
Integrity check of method More complex and realistic example (one of the worst cases): 3168 tracks thrown within detector acceptance. At the end, 1121 tracks survived all PID cuts. Estimated total efficiency is .354 ± .009. 2891 tracks had PC1 found (recorded in CNT)†, pc1 efficiency is .912 ± .005, 22 tracks failed to pass |bbcz|<30, bbcz efficiency is .980±.002, 95 tracks “ have DC UV uniquely found, dc quality “ .921±.003, 130 tracks “ pass PC3 found & 3σ matching, pc3 “ .896±.004, 10 tracks “ pass EMCal 3σ matching, emcal matching “ .991±.001, 762 tracks “ pass EMCal shower shape, emcal shower shape “ .595±.005, 169 tracks “ pass RICH n1>0 and disp<8, rich n1>0 & disp>8 “ .868±.004, Estimated total efficiency is .377 ± .004. † In real data, PC1 efficiency is incorporated into geometrical acceptance correction. Will revisit later. To demonstrate how this method works, charged pion tracks have been generated with exodus to go through detectors and get reconstructed with PID cuts. Results confirm integrity of this method. (In most cases, results from 2 methods are consistent within uncertainties.) PLHF PWG
Definition of ALL (Double longitudinal asymmetries) Maximum Likelihood estimator For asymmetries of A fill
Spin dependent systematic effect test: fake asymmetries and theirχ2 distributions This means that χ2 test can be used as a tool to test how normal your random variables are! xj: Calculated asymmetry for jth fill
Create fake asymmetries by assigning a random spin pattern to each bunch in order to perform a χ2 test. Fit the asymmetries across the fills and get a symmetry for each turn. Repeat it n~10000 times. Get an asymmetry distribution with n entries as well as a U distribution with n entries.
π- π+ π+ π- Bunch shuffled ALL χ2 distribution
What does having good χ2 distribution mean? It tells us the random variable for each “fill” is independent of one another. In other words, there is no correlated uncertainties between fills. Also, the asymmetry variable for each fill xi is very close to normal.
Spin dependent systematic effect test: Single spin asymmetries Definition Maximum likelihood estimator
We know that pion production is parity conserving process. So we expect the asymmetries for all patterns to be zero within statistics. If not, it indicates there are “bunch to bunch” correlated effects or something is wrong.
Spin dependent systematic effect test: Null hypothesis test 4 Spin patterns Uncertainties on ALL asymmetries are guaranteed to be Gaussian by Central limit theorem as we saw in shuffled asymmetries. Thus we do a 2 sample problem z-test for the null hypothesis μi=μj(i,j: spin patterns).
z-ratio mostly <1.0, hypothesis valid at the significance level of α=0.10.
Other theory comparisons for ALL SPIN 2012 in Dubna, Russia
Fragmentation functions and assumptions SPIN 2012 in Dubna, Russia