Download
1 / 24
240 likes | 342 Views
Experience Michigan!. Kirtland's warbler Photo by Ron Austing Taken in Huron-Manistee National Forest. Live Tree Biomass by County – 2002 RPA. Live Tree Biomass on Forest Land by Aboveground Component, 2004. Total: 793.7 million dry short tons (41.1 dry short tons/acre)

E N D
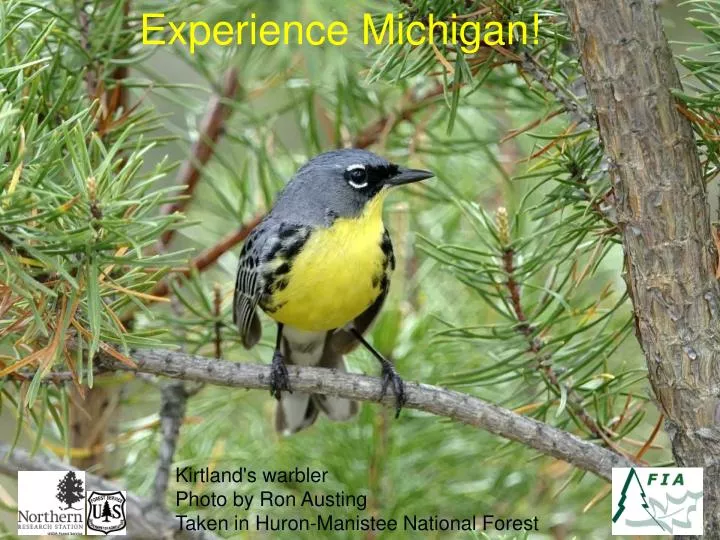
Experience Michigan! Kirtland's warbler Photo by Ron Austing Taken in Huron-Manistee National Forest
Live Tree Biomass on Forest Land by Aboveground Component, 2004 Total: 793.7 million dry short tons (41.1 dry short tons/acre) or 720 metric tons (92.1 metric tons/ha)
Historical Background • Lumber boom and fires of late 1800’s and • early 1900’s – secondary succession followed • Forest land has varied since first FIA inventory in 1935 but 19.7 million acres (8 million hectares) in 2007 – matches high estimate of 1955 • Volume has risen steadily but net growth to volume has slowed since 1935 inventory • Mortality has been consistently low since 1935 inventory • TPO production almost doubled from 1970’s • through 1980’s. 1990’s through 2004 production • has been fairly steady
Timberland and Forest Land by Year (8,094 thousand ha) (6,678 thousand ha)
Growing-stock Volume on Timberland (0.71 billion m3)
Growing-stock Net Growth, Removals and Mortality on Timberland (25.5 million m3) (14.2 million m3) Harvest Removals 2007 Removals Adjusted Harvest TPO
Production of Industrial Roundwood (12.7 million m3)
Forest Land by Owner Class, 2007 2,839 thousand acres 2,914 thousand acres 9,435 thousand acres 4,170 thousand acres 353 thousand acres
1993 to 2004 Noncorporate Private Forest Land Ownership Change
Future Plans for Family Forest Land Owners in Michigan, 2006
Forest Land by Stocking Class and Inventory Unit, 2004
Current Volume, Average Annual Net Growth, Mortality and Removals by Owner