Download
1 / 30
300 likes | 418 Views
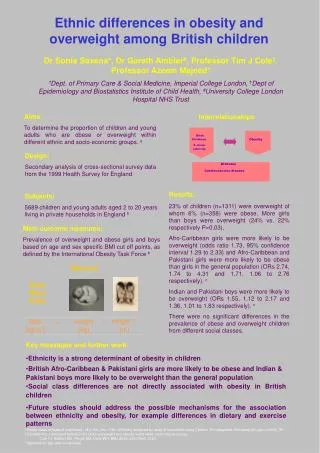
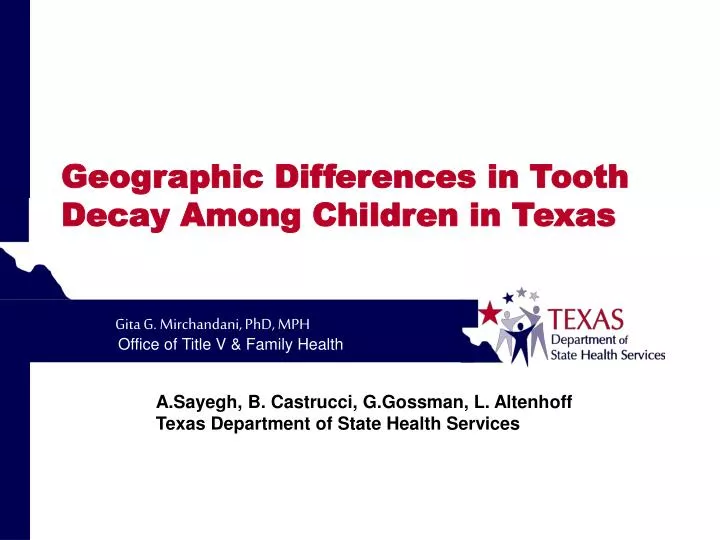
Gita G. Mirchandani, PhD, MPH. Geographic Differences in Tooth Decay Among Children in Texas. A.Sayegh, B. Castrucci, G.Gossman, L. Altenhoff Texas Department of State Health Services. Background. Dental caries (tooth decay)--most common chronic childhood disease

E N D
Gita G. Mirchandani, PhD, MPH Geographic Differences in Tooth Decay Among Children in Texas A.Sayegh, B. Castrucci, G.Gossman, L. Altenhoff Texas Department of State Health Services
Background • Dental caries (tooth decay)--most common chronic childhood disease • Healthy People 2010 oral health indicators • 2 specifically address prevalence of dental caries
Healthy People 2010 Objectives • 21-1 Dental caries experience • 21-1b. Reduce the proportion of children [6-8 years] with dental caries experience in their primary and permanent teeth
Healthy People 2010 Objectives • 21-2 Untreated dental decay • 21-2b. Reduce the proportion of children [6-8 years] with untreated dental decay in primary and permanent teeth
Dental Caries Experience US Target Texas
Untreated Caries (tooth decay) Texas US Target
Data • Basic Screening Survey (BSS) • August 2004-May 2006 • Sample of underserved children • School-based: 110 schools with ≥50% of students on free/reduced lunch program • 17,344 Texas school children aged 2-14
Outcome Measures • Dental Carries Experience:Proportion of children aged 6-8 years with caries experience (treated and untreated tooth decay) • Untreated tooth decay: Proportion of children aged 6-8 years with untreated tooth decay.
Explanatory Variables • Socioeconomic status • Not poor (Non-Free/Reduced lunch & Non-Medicaid) • Poor (Free/Reduced lunch, Non-Medicaid) • Very poor (Free Lunch & Medicaid)
Explanatory Variables • Border (Yes/No) • 32 county border region designated by the U.S.-Mexico border health commission • Race/Ethnicity
Dental Caries Experience Not Poor Poor Poorest
Dental Caries Experience Non-Border Border
Untreated Caries Poor Not Poor Poorest
Untreated Caries Non-Border Border
Conclusions • Regardless of geography, poorer children had a greater prevalence of ever having any tooth decay (treated & untreated) • Regardless of geography, poor children had a greater prevalence of untreated caries than not poor children, but prevalence decreases in the poorest group, likely due to Medicaid
Conclusions • Regardless of geography, poorer children had a greater prevalence of ever having any tooth decay (treated & untreated) • Regardless of geography,Poor children had a greater prevalence of untreated caries than not poor children, but prevalence decreases in the poorest group, likely due to Medicaid
Extra Slides • EXTRA SLIDES
CSTE/NACDDOral Health Indicators • 1) Dental Visit: % of Adults 18+ who have visited a dentist or dental clinic in the past year. • 2)Teeth Cleaning: % of Adults 18+ who have had their teeth cleaned in the past year (among adults with natural teeth who have ever visited a dentist or dental clinic).
CSTE/NACDDOral Health Indicators • 3) Complete Tooth Loss:%Adults aged 65+ who have lost all of their natural teeth due to tooth decay or gum disease. • 4) Lost 6+ teeth: % Adults aged 65+ who have lost six or more teeth due to tooth decay or gum disease.
CSTE/NACDDOral Health Indicators • 5) Fluoridation Status:Percentage of people served by public water systems who receive fluoridated water. • 6) Dental Sealants: Percentage of 3rd grade students with dental sealants on at least one permanent molar tooth.
CSTE/NACDDOral Health Indicators • 7) Carries Experience:Percentage of 3rd grade students with caries experience, including treated and untreated tooth decay • 8) Untreated tooth decay: Percentage of 3rd grade students with untreated tooth decay.
CSTE/NACDDOral Health Indicators • 9) Cancer of the Oral Cavity & Pharynx
Oral Health Indicators—Children (1) • Carries Experience:Percentage of 3rd grade students with caries experience, including treated and untreated tooth decay • Untreated tooth decay: Percentage of 3rd grade students with untreated tooth decay.
Oral Health Indicators: Children (2) • Dental Sealants: Percentage of 3rd grade students with dental sealants on at least one permanent molar tooth.
Background • Dental caries (tooth decay)--most common chronic childhood disease • Oral health indicators developed by CSTE & NACDD • 9 indicators, 3 address children • 2 specifically address prevalence of dental caries