Download
1 / 35
400 likes | 467 Views
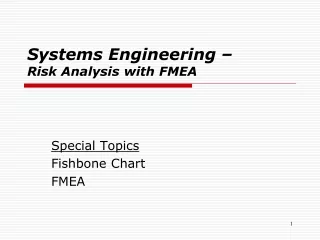
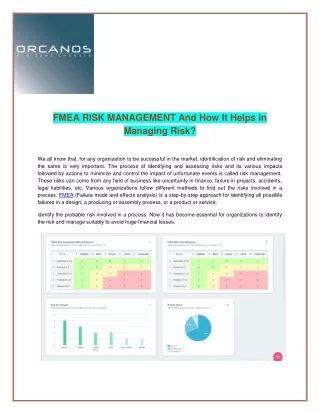
Risk Identification FMEA. F ailure M ode E ffects A nalysis. Failure at 30,000 feet. FMEA Tool Identifies Risks. Risks of Failure in both Design and Process Identified risks for customers, the business, our personnel and the environment, etc.

E N D
Risk IdentificationFMEA Failure Mode Effects Analysis
Failure at 30,000 feet Quality Solutions
FMEA Tool Identifies Risks • Risks of Failure in both Design and Process • Identified risks for customers, the business, our personnel and the environment, etc. • Tool to help identify and prioritize risks • Types of FMEA: • Design FMEA – DFMEA • Process FMEA - PFMEA • Implementation FMEAs (for starting new processes) • Special PFMEA (used as a specific problem solving tool) Quality Solutions
PFMEA - Critical Questions • What in the process can go wrong? • Potential Failure Modes • Whenfailure happens what is the effect on the customer and how bad is ailure? • Effect and Severity • Why does it happen and how often? • Causes and Occurrence • How will failure be detected and corrected before it leaves the process? • Controls and Detection Quality Solutions
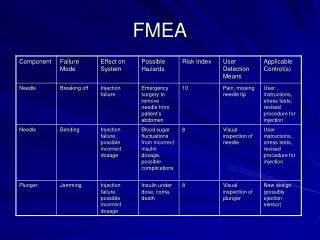
Risk Identification Process Failure Mode and Effect Analysis Function: Process Step Failure Mode Controls Detectability (1-10) Effects Severity (1-10) Causes Occurrence (1-10) RPN =Risk Priority Number RPN = S x O x D = 1 to 1000 Quality Solutions
Quality by Design DFMEA Design Failure Mode and Effects Analysis Quality Solutions
Design - DFMEA Format Quality Solutions
Benefits - Design FMEA • Aidsin design to reduce risks. • Evaluatesdesign requirements / alternatives. • Identifieshow a product may fail to meet its intended function. • Examinespotential consequences of failure. • Prioritizes corrective actions needed. Quality Solutions
Information Source • Boundariesfor Customer change notification • Identifiesspecial characteristics for PFMEA • Rankspotential failure modes according to their effect on the custome • Prioritizesrisks & improvement opportunities • Problem Solving Tool when analyzing customer product concerns Quality Solutions
Team Requirement ? • Team Activity • Team Leader / Facilitator • Design and Development Engineers • Process Engineers • Manufacturing Supervisors and Operators • Others Participate as Needed • Quality Assurance • Quality Engineers • Customers of Product • Suppliers of Raw Materials and Equipment Quality Solutions
Function, Expectation, Failure 1. List Product Functions • Appearance, Performance, Processability, ... 2. List Customer Expectations • Appearance – Looks Good; Clean; Shiny; No defects... • Performance – Resistant to damage; Starts and runs ... • Processability – Easy to use & Easy to make... 3. Translate into Failure Modes • Looks Good – Not shiny; Dirty; Not at expectations ... • No Defects – Scratches; Dents; Broken parts ... • Starts Easy – Will not start; Hard to start... Quality Solutions
Functions & Failure Modes Quality Solutions
Effects or Consequences • Identify Effects as perceived by Customer. • What could be the result of failure mode? • Describe in terms of what the customer might experience or notice. • Customer Dissatisfaction • Warranty Costs and Production Line Rework • Consider “Customer” to also be “internal customers” as well as final or ultimate end users. Quality Solutions
Severity Ratings Quality Solutions
Design Matrix • Materials and Parts Select Materials, Parts and Quantity Levels • Material - Failure under 47% to over 58% by Weight • Part - Failure under X % to over Z % • Material and Part Characteristics Establish Material and Part Specifications Identify significant properties which have a major impact on final product performance • Material: Failure under or over amounts used • Part : Failure to meet specification (under/over ) Quality Solutions
Design Matrix • Product Characteristics Select tests and specifications which determine the ultimate performance of the product. • Time to Temp.: Failure under or over specification • Solids - Failure under 65% to over 73% by weight • Pressure Test: Failure @ 5 psi • Process Constraints Identify significant manufacturing constraints • Equipment Required: Stainless, special tools • Space and Line Requirements: Sq Footage; height Quality Solutions
Design Matrix • Conditions for Use Identify significant constraints in the conditions involved when the Customer uses of the product. • Film Build - Failure under 2.0 mils. • Bake Time @ 350°F - Failure under 20 minutes. • Bake Temperature @ 20 min. - Failure under 350°F. • Shelf Life - Failure after Six Month • Storage Temperature - Failure over 70°F. • Humidity - Failure over 60% relative humidity • Temperature (paint): Failure under 50°F to over 120°F Quality Solutions
Design Matrix - Quality Solutions
Occurrence Table Quality Solutions
DFMEA Form Quality Solutions
Design Controls • Identify Design Controls • Designed Experiments (DOE) • Customer Validation Tests, Trial Runs • Test Protocols, Test Methods • Subcontractor Third Party Testing • Engineering General Practice Ranges Quality Solutions
Detection - Chance of Escape • How likely will design failures escape through our controls to customer? • High likelihood = High number • Low likelihood = Low number • Will current Design Controls detect and stop the causes of failure. • Designed Experiments (DOE) • MSA and Gage R&R results Quality Solutions
Design - Detection Table Quality Solutions
Improvement Action Plan • Recommended Action(s) • Responsibility & Target Dates • Actions Taken • Resulting Risk Analysis • Severity • Occurrence • Detection • RPN Quality Solutions
DFMEA Form Quality Solutions
“Living Document” • Select Areas for Improvement. (high risk) • Formulate plans for corrective actions. • Implement additional corrective actions. • Re-compute the risk assessment (RPN). • Up-Date and Maintain • Update as new information is available. • Record all changes made to Product or Process. • Revise as experience grows. Quality Solutions
Importance of Prioritization Quality Solutions
Priority and Practicality Quality Solutions
DFMEA – Cup of Coffee Quality Solutions
DFMEA for Making Coffee Quality Solutions
Functions & Failure Modes Quality Solutions
Design Matrix - Quality Solutions
DFMEA Form Quality Solutions
Design FMEA Thank You! Quality Solutions