Download
1 / 1
10 likes | 121 Views
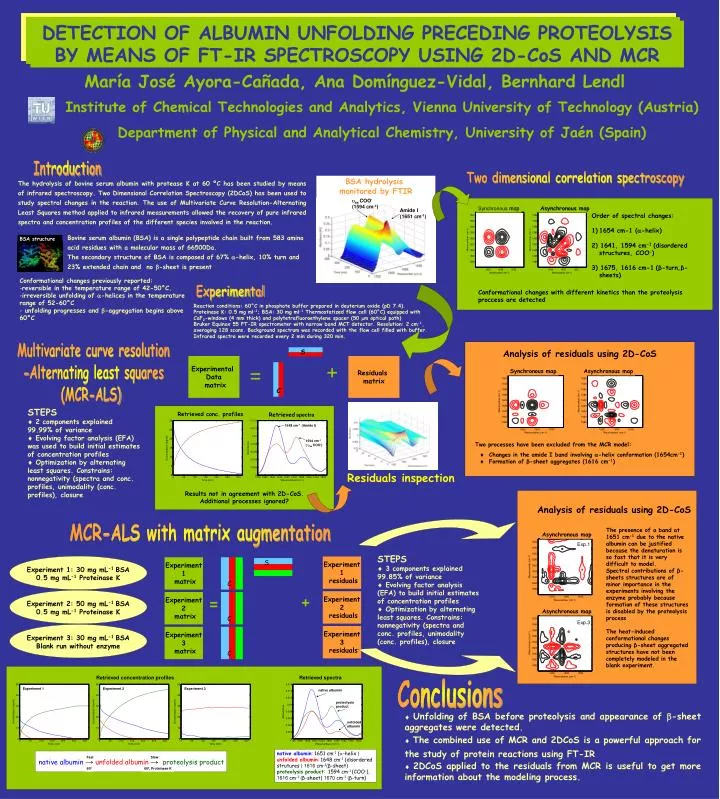
BSA hydrolysis monitored by FTIR. as COO - (1594 cm -1 ). Amide I (1651 cm -1 ). BSA structure. S. Experimental Data matrix. Residuals matrix. Analysis of residuals using 2D-CoS. Synchronous map. Asynchronous map. C. Retrieved conc. profiles. Retrieved spectra.

E N D
BSA hydrolysis monitored by FTIR as COO- (1594 cm-1) Amide I (1651 cm-1) BSA structure S Experimental Data matrix Residuals matrix Analysis of residuals using 2D-CoS Synchronous map Asynchronous map C Retrieved conc. profiles Retrieved spectra 1648 cm-1 (Amide I) 1594 cm-1 ( as COO-) Two processes have been excluded from the MCR model: Changes in the amide I band involving -helix conformation (1654cm-1) Formation of β-sheet aggregates (1616 cm-1) Results not in agreement with 2D-CoS. Additional processes ignored? Asynchronous map Exp.1 Experiment 1 residuals Experiment 1 matrix S C Experiment 2 residuals Experiment 2 matrix Asynchronous map C Exp.3 Experiment 3 residuals Experiment 3 matrix C Experiment 1 Experiment 2 Experiment 3 native albumin proteolysis product unfolded albumin Fast Slow native albumin→ unfolded albumin→ proteolysis product 60º 60º, Proteinase K DETECTION OF ALBUMIN UNFOLDING PRECEDING PROTEOLYSIS BY MEANS OF FT-IR SPECTROSCOPY USING 2D-CoS AND MCR María José Ayora-Cañada, Ana Domínguez-Vidal, Bernhard Lendl Institute of Chemical Technologies and Analytics, Vienna University of Technology (Austria) Department of Physical and Analytical Chemistry, University of Jaén (Spain) Introduction Two dimensional correlation spectroscopy ST The hydrolysis of bovine serum albumin with protease K at 60 ºC has been studied by means of infrared spectroscopy. Two Dimensional Correlation Spectroscopy (2DCoS) has been used to study spectral changes in the reaction. The use of Multivariate Curve Resolution-Alternating Least Squares method applied to infrared measurements allowed the recovery of pure infrared spectra and concentration profiles of the different species involved in the reaction. Synchronous map Asynchronous map • Order of spectral changes: • 1654 cm-1 (-helix) • 2) 1641, 1594 cm-1 (disordered structures, COO-) • 3) 1675, 1616 cm-1(β-turn,β-sheets) Bovine serum albumin (BSA) is a single polypeptide chain built from 583 amino acid residues with a molecular mass of 66500Da. The secondary structure of BSA is composed of 67% -helix, 10% turn and 23% extended chain and no -sheet is present • Conformational changes previously reported: • reversible in the temperature range of 42-50°C. • irreversible unfolding of -helices in the temperature range of 52-60°C • unfolding progresses and -aggregation begins above 60°C Experimental Conformational changes with different kinetics than the proteolysis proccess are detected Reaction conditions: 60°C in phosphate buffer prepared in deuterium oxide (pD 7.4). Proteinase K: 0.5 mg ml-1; BSA: 30 mg ml-1 Thermostatized flow cell (60°C) equipped with CaF2-windows (4 mm thick) and polytetrafluoroethylene spacer (50 m optical path) Bruker Equinox 55 FT-IR spectrometer with narrow band MCT detector. Resolution: 2 cm-1, averaging 128 scans. Background spectrum was recorded with the flow cell filled with buffer. Infrared spectra were recorded every 2 min during 320 min. Multivariate curve resolution -Alternating least squares (MCR-ALS) STEPS 2 components explained 99.99% of variance Evolving factor analysis (EFA) was used to build initial estimates of concentration profiles Optimization by alternating least squares. Constrains: nonnegativity (spectra and conc. profiles, unimodality (conc. profiles), closure Residuals inspection Analysis of residuals using 2D-CoS MCR-ALS with matrix augmentation The presence of a band at 1651 cm-1 due to the native albumin can be justified because the denaturation is so fast that it is very difficult to model. Spectral contributions of β-sheets structures are of minor importance in the experiments involving the enzyme probably because formation of these structures is disabled by the proteolysis process The heat-induced conformational changes producing β-sheet aggregated structures have not been completely modeled in the blank experiment. time STEPS 3 components explained 99.85% of variance Evolving factor analysis (EFA) to build initial estimates of concentration profiles Optimization by alternating least squares. Constrains: nonnegativity (spectra and conc. profiles, unimodality (conc. profiles), closure Experiment 1: 30 mg mL-1 BSA 0.5 mg mL-1 Proteinase K Experiment 2: 50 mg mL-1 BSA 0.5 mg mL-1 Proteinase K Experiment 3: 30 mg mL-1 BSA Blank run without enzyme Retrieved concentration profiles Retrieved spectra Conclusions Unfolding of BSA before proteolysis and appearance of -sheet aggregates were detected. The combined use of MCR and 2DCoS is a powerful approach for the study of protein reactions using FT-IR 2DCoS applied to the residuals from MCR is useful to get more information about the modeling process. native albumin: 1651 cm-1 (-helix ) unfolded albumin: 1648 cm-1 (disordered strutures ) 1616 cm-1(β-sheet) proteolysis product: 1594 cm-1 (COO-), 1616 cm-1 (β-sheet) 1670 cm-1 (β-turn)