Download
1 / 19
190 likes | 276 Views
Common Core Math I Unit 2 Day 1 One-Variable Statistics. Two Main Uses of Statistics. TO DESCRIBE (Data Analysis) TO PREDICT (Statistical Inference). Definitions. Data: A collection of information in context.

E N D
Two Main Uses of Statistics TO DESCRIBE (Data Analysis) TO PREDICT (Statistical Inference)
Definitions • Data: A collection of information in context. • Population: A set of individuals that we wish to describe and/or make predictions about. • Sample: A subset of the population that data is collected from. • Individual: Member of a population. • Variable: Characteristic recorded about each individual in a data set.
Types of Variables • Categorical Variable: A variable that records qualities or characteristics of an individual, such as gender or eye color. • Quantitative Variable:A variable that measures a characteristic of an individual, such as height, weight, or age. In this unit, we will focus on quantitative data.
Categorical or Quantitative Data? • Birth month • Number of siblings • Height in inches • Average amount of time (in minutes) of your ride to school. • Number of pets • Year & model of the car you drive • Age of your youngest parent • Predicted letter grade of your first Math 1 test.
1. Brand of vehicle purchased by a customer 2. Price of a CD 3. Number of students in a class of 30 who prefer peanut M&Ms over plain M&Ms 4. Phone number of all the students enrolled in school. 5. The height of a 1 year old child. 6. Number of students in a class of 35 who turn in a term paper before the due date. 7. Gender of the next baby born at a particular hospital. 8. Amount of fluid (oz) dispensed by a machine used to fill bottles with soda. 9. Thickness of the gelatin coating of a Vitamin C capsule 10. Brand of computer purchased by a customer 11. State of birth for someone born in the United States. 12. Price of a textbook 13. The phone numbers of everyone in this class. 14. Actual weight of coffee in a one pound can. 15. The length of a rattlesnake.
Describing Data Two ways to describe data: • Graphically • Numerically
Describing Data Graphically • Dotplot • Histogram • Boxplot
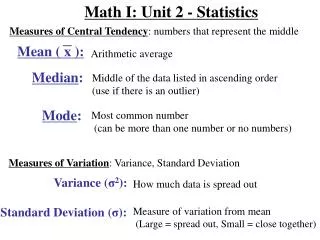
Describing Data Numerically • Measures of Center – mean, median • Measures of Spread – range, interquartile range, standard deviation
Measures of Center What is the typical value?
Measures of Spread How much do values typically vary from the center? • Range • Interquartile Range (IQR) • Standard Deviation
Common Core Math IUnit 2 Day 2Frequency Tables and Histograms
Link Up • Frequency Distribution Table • Histogram (by hand)
Describing Distributions • Shape • Center • Spread • Outliers
Shape • Mound shaped & symmetrical • Skewed left (extreme low values) • Skewed right (extreme high values) • Uniform
Center When describing a distribution at first, the center can be “eyeballed.” Remember, you are trying to answer the question: “What is the most typical value?”
Spread Range Remember, you are trying to answer the question: “How much do values typically vary from the center?” BE SURE TO STATE EVERYTHING IN CONTEXT!!
NFL Rushing Statistics Group activity: • Make a frequency distribution table for your assigned column of data. • Draw the corresponding histogram on graph paper. • Write a paragraph about your data that addresses shape, center, spread, and outliers.