Download
1 / 61
620 likes | 763 Views
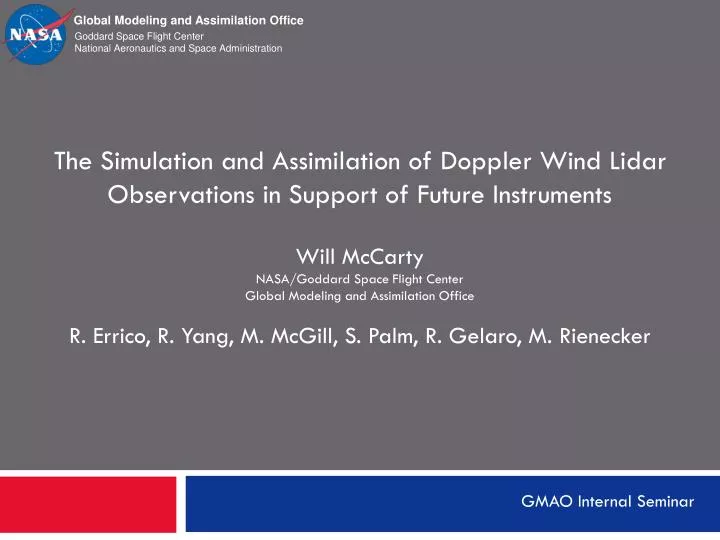
The Simulation and Assimilation of Doppler Wind Lidar Observations in Support of Future Instruments Will McCarty NASA/Goddard Space Flight Center Global Modeling and Assimilation Office R. Errico, R. Yang, M. McGill, S. Palm, R. Gelaro, M. Rienecker. OSSE for ADM Preparedness.

E N D
The Simulation and Assimilation of Doppler Wind Lidar Observations in Support of Future InstrumentsWill McCartyNASA/Goddard Space Flight CenterGlobal Modeling and Assimilation OfficeR. Errico, R. Yang, M. McGill, S. Palm, R. Gelaro, M. Rienecker GMAO Internal Seminar
OSSE for ADM Preparedness • There is no predecessor for spaceborne DWL • Sources of proxy data • Ground-based instruments • Inadequate spatial sampling • Adapt existing spaceborne measurements • Completely different in nature than spaceborne DWL • Simulated Observations • Can be simulated anywhere • If done properly, they can contain all of the necessary characteristics to best emulate real data: • Spatial and vertical sampling • Yield • Error characteristics
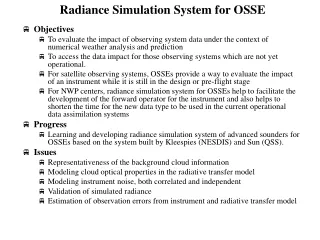
Simulating a Realistic Observing System • A successful OSSE requires realistic fake observations • Realistic Errors, need to account for • Instrument noise • Observation contamination • data yield, i.e. clouds, precipitation • Representativeness • sub-gridscale variability • Effort performed on Joint OSSE Nature Run by R. Errico and R. Yang @ GMAO
Simulating Doppler Wind Lidar Observations • Simulation of ADM is dependent on key fields • Backscatter & extinction from the atmosphere, clouds, and aerosols • 3D wind field • Only the wind field is inherent to the nature run • Molecular/Rayleigh backscatter – f(T,p) • Cloud backscatter/extinction – f(Cloud Fraction, CLWC, CIWC) • Aerosol backscatter/extinction • Not inherent to NR • ADM measures at a scale finer than that of the NR • Need to account for sub-gridscale variability • The DJF season of the NR is compared to the seasonally corresponding CloudSat/CALIPSO (CS/CAL) record
Comparing NR Clouds to CloudSat/CALIPSO • Only cloud fraction is considered • CS/CAL • Level 2B GEOPROF-LIDAR product • 1 km resolution along-track, reports up to five cloud layers • Only consider highest vertical cloud • NR • A maximum-random overlap scheme implemented for sub-gridscale variability • Adjoining model levels to have maximum overlap • If two clouds exist in a vertical column with clear-sky between them, random overlap is assumed • Sampling the same as one season of the CS/CAL data • Comparisons are made in 5° bins
Clouds in the Joint OSSE Nature Run • Importance of clouds • The top of a cloud can act as a scattering agent • Optically thick clouds limit wind retrievals • Placement of clouds • Realistic vertical placement of clouds • NR underestimates cloud amount • ~12% globally • Related to measurement yield CALIPSO/ CloudSat L2 Nature Run
Clouds in the Joint OSSE Nature Run • Cloud Fraction for all clouds • Clear lack of clouds in NR Nature Run Difference CS/CAL
Aerosols in the Joint OSSE Nature Run • Importance of aerosols • Aerosols act as a scattering agent • Placement of aerosols • Not available in the NR • Traditionally taken from a climatological background • Inconsistent with atmospheric state • Dynamically consistent aerosol fields • Unique GSFC effort • GOCART aerosol transport model embedded in the GEOS-5 model • Aerosol fields forced by the meteorology of the Nature Run
Aerosol Validation • Jan NR vs. Jan 2006 • NR Replay sampled at MODIS/MISR retrievals for consistency • Clear sky, daytime only MODIS (Terra) MISR (Terra) NR Replay SAT NR - SAT (R. Govindaraju)
Simulated Doppler Wind Lidar Observations • Simulated ADM measurements • Nature Run • LIPAS • ADM Simulator developed at KNMI • Not run in “Burst Mode” Cloud Extinction Coefficient Retrieved HLOS Wind (Rayleigh)
Simulated Doppler Wind Lidar Observations • Simulated ADM measurements • Nature Run • LIPAS • ADM Simulator developed at KNMI • Not run in “Burst Mode” Cloud Extinction Coefficient Retrieved HLOS Wind Error (Rayleigh)
Simulated Doppler Wind Lidar Observations • Simulated ADM measurements • Nature Run • LIPAS • ADM Simulator developed at KNMI • Not run in “Burst Mode” Cloud Extinction Coefficient Retrieved HLOS Wind (Rayleigh)
Simulated Doppler Wind Lidar Observations • ADM Obs (cont’d) • cloud and aerosol fields consistent • Mie channel sampling illustrated Aerosol Extinction Coefficient Retrieved HLOS Wind (Mie)
Assimilation and Forecast Impacts • The results shown are applicable to January of the nature run period • DAS Runs every 6 hr with a +/- 3 hr observation window • Analyses are considered 2x/day (00/12 UTC) • Forecasts are considered 1x/day (00 UTC) • Observations included in Control • Based on operational data for Jan. 2006 • Conventional (incl. RAOB & Satellite Winds), TOVS (MSU, AMSU A/B, HIRS), AIRS • Observations for DWL Experiment • Control + ADM
Assimilation Results • Doppler Wind Lidar O-F RMS vertically
Assimilation Results • Change in DWL RMS Vertically for RAOB T, RH, and uv
Assimilation Results • RAOB observations biased towards Northern Hemisphere midlatitudes • OSSE framework allows comparison between the analysis and a known truth in analysis space ADM Radiosonde Observation Locations
Assimilation Results Increase in RMS Reduction in RMS Wind Component RMS Difference (ms-1)
Assimilation Results Increase in RMS Reduction in RMS Geopotential Height RMS Difference (m)
Assimilation Results Reduction in RMS Increase in RMS Temperature RMS Difference (ms-1)
Impact on Forecast 500 hPa Height Anomaly Correlation (CTL) NH – 0.8509 SH – 0.8192
Impact on Forecast 500 hPa Height Anomaly Correlation (DWL) NH – 0.8555 SH – 0.8301
Conclusions and Future Efforts • There are known flaws with the current use of ADM data in the OSSE experiment • Observations are too ideal (quality & quantity) • Representativeness errors are underspecified • Expand experiment to increase statistical robustness • ADM Effort readily translates to studies for 3D-Winds decadal survey mission • Incorporate L2B processing into GSI system • Accelerate ADM/future DWL observation usage into operations • Joint Center for Satellite Data Assimilation task
Introduction • Importance of Wind Measurements • Global wind profiles are “essential for operational weather forecasting on all scales and at all latitudes” • World Meteorological Organization (1996) • Atmospheric Winds from the ground • Global Rawinsonde Record • Ground-based, remotely sensed wind observations • Mainly in data rich regions • Atmospheric Winds from Space • Atmospheric Motion Vectors (AMVs) and Scatterometers Director's Seminar
Introduction to Doppler Wind Lidar • The Doppler Wind Lidar Concept • Lidar backscatter is Doppler shifted by a scattering agent • Improved accuracy in height assignment • Spaceborne Doppler Wind Lidar • Global, 3D measurements of wind • NASA 3D-Winds(NRC Decadal Survey recommendation) • Full horizontal wind • ESA ADM-Aeolus (2012) • single horizontal wind component ADM Radiosonde Observation Locations
ADM-Aeolus • Direct-Detection technique (355 nm) • Vertical single-component profiles in clear sky (Rayleigh) • Higher quality measurements in presence of scattering agent (Mie) • Orbit Characteristics • 408 km • Dawn-dusk • Sun-synchronous • Viewing Geometry/Sampling • 90° off-track (away from sun) • 7 second measurements (~50 km) • One measurement every 200 km
ADM-Aeolus Pre-Assimilation Data Flow Chart • Downlink • Location: Svalbard • Latency • Near-Realtime: 3 hr • Quasi-Realtime: 30 min • Processing & Distribution • L1B distributed in NRT by ESA via GTS • L2B product will be produced by ECMWF (IFS) • NRT modeling centers will have to run L2B processing independently • Best scientific methodology due to first-guess dependency
ADM-Aeolus Pre-Launch Data Flow Chart • Prior to launch, realistic data for system preparedness • Establish a realistic dataset for data assimilation system development • Local Proxy Data • Generated using OSSE framework • Purpose of this effort is not to “sell” instrument (already sold) • Establish a realistic end-to-end flow to test mechanics of system • NRT Proxy Data • To be considered closer to launch
Data Assimilation • Variational Cost Function: • When minimized, x = xa (analysis state) • H[x] transforms the atmospheric state to observation space • Currently, H[x] is a projection of the winds to line-of-sight space • Upon launch, H[x] will include L2B processing
Simulated Doppler Wind Lidar Observations • Simulated from a modeled atmospheric state • Errors increase with height • Clear-Sky backscatter coefficient and line-of-sight wind error are inversely proportionate • Clouds degrade measurement quality Backscatter Coefficient Altitude (km) LOS Wind Error 20 20 15 15 10 10 5 5 0 0 20 15 10 5 0 LOS wind error (m/s) backscatter coefficient (m-1 sr-1) 10-3 10-5 10-7 10-8 (M. McGill, S. Palm) 60 0 Latitude
Simulated Doppler Wind Lidar Observations • Aerosol detection has reduced error Backscatter Coefficient Altitude (km) LOS Wind Error 20 20 15 15 10 10 5 5 0 0 20 15 10 5 0 LOS wind error (m/s) backscatter coefficient (m-1 sr-1) • Molecular detection full wind profiles vertically 10-3 10-5 10-7 10-8 (M. McGill, S. Palm) 60 0 Latitude
Aerosol Validation • Terra (left) • Aqua (right) • NR (top) • MODIS (middle) • NR – MODIS (bottom) (R. Govindaraju)
Introduction • Importance of Wind Measurements • Global wind profiles are “essential for operational weather forecasting on all scales and at all latitudes” • World Meteorological Organization (1996) • Atmospheric Winds from the ground • Global Rawinsonde Record • Ground-based, remotely-sensed wind observations • Mainly in data rich regions • Atmospheric Winds from Space • Atmospheric Motion Vectors (AMVs) and Scatterometers
Doppler Wind Lidar • The Doppler Wind Lidar Concept • Lidar backscatter is Doppler shifted by a scattering agent • Improved accuracy in height assignment • Spaceborne Doppler Wind Lidar • Global, 3D measurements of wind • ESA ADM-Aeolus (late 2011) • single horizontal wind component • NASA 3D-Winds(NRC Decadal Survey recommendation) • Full horizontal wind
ADM-Aeolus • Direct-Detection technique (355 nm) • Vertical single-component profiles in clear sky (Rayleigh) • Higher quality measurements in presence of scattering agent (Mie) • Orbit Characteristics • 408 km • Dawn-dusk • Sun-synchronous • Viewing Geometry/Sampling • 90° off-track (away from sun) • 7 second measurements (~50 km) • One measurement every 200 km
ADM-Aeolus Pre-Assimilation Data Flow Chart • Downlink • Location: Svalbard • Latency • Near-Realtime: 3 hr • Quasi-Realtime: 30 min • Coverage Gaps • N. America in NRT • N. America and S. Hemisphere in QRT • Wallops Ground Station solution for data gaps being considered ADM Pass Duration at Svalbard (red) and Wallops (blue) (L. P. Riishojgaard) Confidence of Statement: Fact, Possible, Unsure
ADM-Aeolus Pre-Assimilation Data Flow Chart • Near-Realtime Processing & Distribution • L1B distributed in NRT by ESA • BUFR table description not finalized • BUFR is a WMO standard for data distribution • L2B will be produced by ECMWF as part of integrated forecast system (IFS) • Unavailable to other operational systems (timeliness) • All major DA centers will have to run L2B processing independently • Best scientific methodology due to first-guess dependence of the processing Confidence of Statement: Fact, Possible, Unsure
Data Assimilation y – H[x] = y – (H[xb] + Hδx) • H[x] transforms the background/guess state to observation space • If in the same space, as simple as an interpolation • If in different space, H can be radiative transfer (radiances), a projection of the winds (DWL LOS or radial winds) • To solve the minimization, the H operator is linearized about the background state to form H • To compensate for nonlinearities, multiple linearizations, or outer loops, are performed in the analysis solution
Doppler Wind Lidar and Data Assimilation • Dynamics and Thermodynamics statistically coupled via the B matrix • Works fairly well for the extratropics and synoptic situations • So why busts? • Ageostrophy = a more complicated forecast • Primary global measurements are passive sounders (MW & Thermal IR) • Global wind measurements (Scatterometers & GEO winds) • Poor vertical sampling • Poor vertical height assignment • Spatial sampling dependent on presence of a feature to track (i.e. cloud edge, WV gradient) • Necessary to constrain the statistical balance coupling • Poor error characterization
Assimilation of Simulated Doppler Wind Lidar Measurements in Preparation for 3D-Winds and ADM Analysis Inc 200 hPa u-comp(shaded), Tv Analysis Inc 200 hPa v-comp(shaded), Tv • Infrastructure in development to simulate line-of-sight measurements from Joint OSSE Nature Run • 1st step: ADM-like orbit, no addition of error, crude account of cloud structure (no aerosol considerations) • Our data assimilation system (GSI) updated to assimilate these Level-2 measurements
Ongoing and Future Efforts • NR cloud verification journal article (in progress) • Aerosol verification (in progress) • NR cloud tuning – need to compensate for apparent lack of clouds in NR • ADM simulation (in progress) • Use existing DA infrastructure for verification of simulations • DA studies (future) • Full observation system development (in progress) • Refine DA methodologies for ADM, (QC and error handling) • OSSE studies (future) • Consider use and utility of new GMAO 3.5 km NR • Perform “classic” OSSE for 3D-Winds proposal
Aerosols from Nature Run • Aerosol fields generated for entire duration of the Joint OSSE Nature Run • Meteorology of the nature run is converted from ECMWF native (reduced Gaussian) grid to GEOS-5 native (finite volume square) grid • Using real sources from the 2005-06 period, the aerosols are transported in a “replay” mode using GOCART scheme embedded in the GEOS-5 model. • The model is re-initialized every three hours using the converted NR fields\
Aerosols from Nature Run (cont’d) • Aerosols/chemical species considered: • Dust, sea salt, dimethylsulphide, SO2, Sulphates, Methanesulphonic acid, hydrophobic/hydrophilic black carbon, hydrophobic/hydrophilic organic carbon • Mixing ratios are converted to backscatter and extinction using locally developed calculator • Lookup table-centric, point-by-point (in all 3 dimensions) and species-by-species (function of wavelength: 355 nm, 532 nm, 1064 nm have been tested) • Then combined to produce three dimensional fields of backscatter and extinction (and others: SSA, layer AOT, attenuated BS/EX from sfc/toa) • Admittedly, a black box
Aerosol Validation • In validation, the replay aerosols were compared over land and sea for MODIS (Aqua and Terra, separately) and MISR • Only points corresponding to successfully retrieved AOT were considered • Consistent sampling • Daytime only • Showing January “2006” of Nature Run versus real January 2006
Aerosol Validation • Terra (left) • Aqua (right) • NR (top) • MODIS (middle) • NR – MODIS (bottom)
Aerosol Validation • Terra (left) • Aqua (right) • NR (top) • MODIS (middle) • NR – MODIS (bottom)
Aerosol Validation • NR (top) • MISR(middle) • NR – MISR (bottom)