Download
1 / 9
90 likes | 166 Views
Hilandale Sewer Lines. Jeremy Manny GEOG 4100 Spring 2013. Problem Statement.

E N D
Hilandale Sewer Lines Jeremy Manny GEOG 4100 Spring 2013
Problem Statement Areas are becoming more urbanized, more populated which in turn leads to more waste and water being poured back into our local sewer lines. These sewer lines are not built to withstand all of this waste and water being put into it. At some point, one of these lines will burst causing grossness to be everywhere.
backGround Literature Weng, H. and S. Liaw. 2007. An optimization model for urban sewer system hydraulic design. Journal of the Chinese Institute of Engineers. Volume 30. 1:31-42.
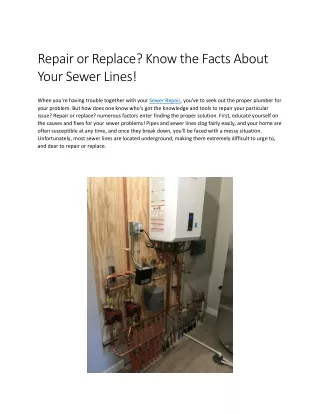
Data Acquisition I was given my area of research by Mark Patrick, the head engineer of the city of Milledgeville, because a new sewer line was put down and has not yet been mapped by the city. I was given a map of all the city’s sewer lines and parcels about a week ago.
Field Data and Geographic Information Science I collected my own data by going out to where the new sewer line was put down and marked manholes and its path via GPS and writing down the coordinates. The reason I chose my area to do the potential weak points for a sewer bust is because I was given the map a week ago. Of course, I used ArcMap to display all of my findings, but I also used Google Maps and Google Earth to pinpoint exactly where the new sewer line was laid down.
Spatial Analysis I decided to divide the Hilandale sewer lines into sections and each section was given an amount of housing parcels to figure out where a potential weak point could occur in the future. The lines were arranged from 0 to 9 houses per line and given a specific color representing the amount of housing pressure on the lines. All of these numbers were given based on what I thought the number of houses on the specific line are.
Results After creating my map with all of the color coding and number of houses given to each line, I came to find 3 lines that could have a potential burst. Each of these lines have 7 to 9 houses respectively. The sewer line might not be built up enough to handle this kind of stress causing breakage and waste disposal all over the neighborhood. If I were to look at the whole area of Milledgeville, there could be more lines that show significant amount of stress.