Download
1 / 17
170 likes | 271 Views
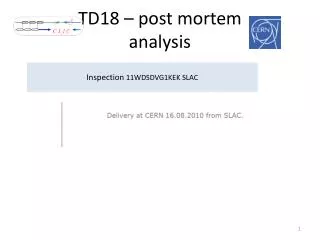
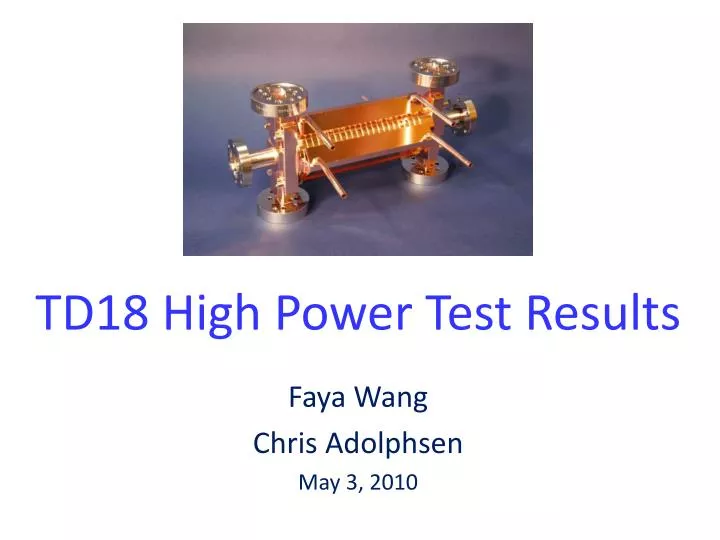
TD18 High Power Test Results. Faya Wang Chris Adolphsen May 3, 2010. CLIC Disk Structure Tests. TD18 Parameters. Last Cell. First. Middle. For regular cells P = 59.8 MW for <G> = 100 MV/m Active Length = 15.8 cm. A. Grudiev. TD18 Parameter Plots for an Unloaded Gradient of 100 MV/m.

E N D
TD18 High Power Test Results Faya Wang Chris Adolphsen May 3, 2010
TD18 Parameters Last Cell First Middle For regular cells P = 59.8 MW for <G> = 100 MV/m Active Length = 15.8 cm A. Grudiev
TD18 Parameter Plots for an Unloaded Gradient of 100 MV/m T18 High DT : 47 degC for 100 ns Pulse whereas T18 is only 12.5 degC
High Power Operation History Final Run at 230 ns: 94 hrs at 100 MV/m w BDR = 7.6e-5 60 hrs at 85 MV/m w BDR = 2.4e-6
TD18 Breakdown Location Profile at Different Stages of Processing
T18 Breakdown Location Profile at Different Stages of Processing Did not find visual evidence related to the hot cell in a post-run boroscope exam – typical of NLC/GLC structures, many of which had hot cells
Comparison with T18_SLAC1 Pulse width 230ns: Green line for TD18, Others for T18
LC Breakdown Limits • For NLC, the breakdown rate limit was chosen so that the 2% pool of spare rf units would rarely (once a year) be depleted assuming a 10 second recovery period after each breakdown. Operation with a 10 second recovery period has been demonstrated but longer times (30-100 sec) are typically used since the structure monitoring system has a 30 second sampling period. For 60 Hz operation at NLCTA, the breakdown rate limit translates to 0.1 per hour with the nominal 60 cm long structure design. This choice is somewhat soft in that a four-times higher rate would still provide 99% full-energy availability assuming a 5 second recovery time, which has also been demonstrated. • For reference, at the 0.1 per hour limit, a breakdown would occur in one of the ~ 20,000 NLC X-Band structures once every 120 pulses. Such breakdowns will degrade the luminosity from that pulse, but the beam kicks from the breakdown fields should not inhibit beam operation. • To 'translate' this limit, for one bkd in 10 hours in a 0.6 m structure at 60 Hz, the rate is 4.6e-7/pulse/structure or 7.7e-7/pulse/m. For CLIC 3-TeV, this same limit gives 1 bkd per 40 pulses, but because of the smaller beam emittance (and hence a smaller collimator aperture), the kicks are more likely to hit the collimators. The bkd kick distribution measured at NLCTA has values as large as 30 keV/c - this level is < 1/10 of the amount needed to hit the collimators at NLC.
Can TD18 Run with no Recovery Period ? Cascaded BDR Test at 100 MV/m @ 200ns 33 Hour Test Period
BDR Pulse Width Dependence 100 MV/m
BDR Pulse Heating Dependence 110 MV/m
Pulse Heating under Different Conditions 1st cell 62% of last cell at pulse heating
TD18 Summary • Structure performed worse than T18 even though it did not have any hot cells. TD18 bead pull data also shows a large phase advance change unlike that for T18 where no change is observed (see Juwen’s talk). • BDR pulse heating dependence suggests that operation above 50 degC may be a factor (as it appears to be in single SW cell data) • Pre-heating test at constant gradient confirms the pulse heating sensitivity (although the statistics are low) • Factor of ~ 3 BDR increase similar to that seen with no pre-heating for the same temperature range. • Perhaps should not draw too strong of conclusion given that this is just one structure, and the KEK TD18 results are even more puzzling.