Download
1 / 43
430 likes | 596 Views
Far Field Measurement of light diverging from multimode optical fibres and encircled angular flux. Dr David R. Selviah and Ruichen Tao, Optical Devices and Systems Laboratory, Photonics Research Group, Department of Electronic and Electrical Engineering, University College London, UCL,

E N D
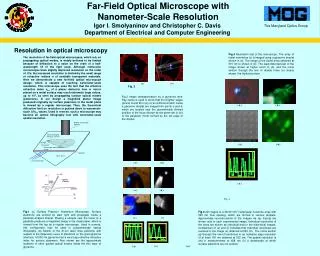
Far Field Measurement of light diverging from multimode optical fibres and encircled angular flux Dr David R. Selviah and Ruichen Tao, Optical Devices and Systems Laboratory, Photonics Research Group, Department of Electronic and Electrical Engineering, University College London, UCL, Torrington Place, London WC1E 7JE Tel: 020 7679 3056 Internal: 33056 Email: d.selviah@ucl.ac.uk www.ee.ucl.ac.uk/staff/academic/dselviah IEC/SC 86B JWG 9 meeting, Ixtapa, Mexico, 23 May 2014
Encircled Angular Flux IEC 61300-3-53 CD (Draft) rev6 • 1 Scope • This part of IEC 61300 series is intended to characterize the encircled angular flux of measurement multimode fibre light sources, in which most of the modes are excited. • Encircled angular flux (EAF) is the fraction of the total optical power radiating from a multimode optical fibre’s core within a certain solid angle. The EAF is being measured as a function of the numerical aperture full angle. The basic approach is to collect, for every measurement, two dimensional far field data using a calibrated camera and to convert them mathematically into encircled angular flux. • IEC 61300-3-53, characterizes light emitted from a multimode fibre. This multimode fibre optical source is intended for precise measurement of the attenuation of devices.
Far Field Pattern (FFP) Measurement Techniques • IEC 61300-3-53 CD (Draft) rev6 describes a range of far field measurement techniques which are subdivided into two classes • Direct Imaging with free space propagation of the divergent light from the fibre end to the sensor – 3 alternate types of sensor are specified – pinhole/integrating sphere, single mode fibre/power meter, CCD camera. The first two sensors can be stepped in x and y on motorised stage micro-positioners to capture the full far field. • F-theta lens transformation of the angular light intensity distribution emerging from a multimode fibre end to a spatial distribution scaled to fit on the sensor plane of a CCD camera • In both cases after the measurements a calculation is carried out to find the Encircled Angular Flux (EAF)
Overview • Description of the direct imaging method using a CCD camera in detail for measuring a 10 m long silica graded index 50 micron diameter multimode fibre and two improvements that we had to develop which will need to be incorporated into the document. • Description of the use of the f-theta measurement method for measuring HPCF 2 km long multimode fibre. • Early initial comparison of the results of the two methods
First Direct Imaging Improvement • The Far field captured on the CCD camera plane needs to be converted to be a function of angle rather than x and y on the CCD camera plane. • This can be achieved using a mapping from the plane to a sphere centred on the end facet of the multimode fibre. • There may be a similar problem for the other two direct imaging techniques as generally the pinhole/integrating sphere and single mode fibre/power meter sensor end will be moved by motorised micro-positioner stages in an x, y plane normal to the axis of the fibre. If a z motorised stage is also available then there is the possibility of moving the small pinhole or end facet of the single mode fibre along the surface of a sphere centred on the end facet of the multimode fibre. Ideally the sensor would also be turned to be normal to the rays incident on it for the best results.
Theory calculation CCD MMF
The effect of plane to sphere error on EAF • 50 micron core diameter, 10 m long GI silica MMF, 38 mm Mandrel, 10, 20, 30 turns, 6 mA driven current, 15 ms exposure time. • Sphere EAF are the solid lines and plane EAF are the dashed lines with 10, 20, 30 turns • Black represents 10 turns, red 20 turns, and dark yellow 30 turns. • There are no obvious differences to EAF.
The effect of plane to sphere error on plane error • Using plane error we can see the difference
Schematic diagram • Distance between CCD and fibre end: d=16 ± 1 mm • CCD: 7.1280 mm × 5.3680 mm • GI-MMF: NA=0.20 ± 0.015, length=10 m
Experimental Variables • Mandrel diameter • Number of turns of the fibre around the mandrel • LED control current • Exposure time
Label: d (mm)-mandrel diameter (mm)-turns-current (mA)-exposure time (ms) 13 mm Mandrel
Label: d (mm)-mandrel diameter (mm)-turns-current (mA)-exposure time (ms) 38 mm Mandrel • EAF of 20 and 30 turns are the same • EAF of 0 and 5 turns are nearly the same
Label: d (mm)-mandrel diameter (mm)-turns-current (mA)-exposure time (ms) 58 mm Mandrel • EAF decreases as the number of turns decreases • EAF of 10 and 20 turns is nearly the same
Label: d (mm)-mandrel diameter (mm)-turns-current (mA)-exposure time (ms) 66 mm Mandrel
Label: d (mm)-mandrel diameter (mm)-turns-current (mA)-exposure time (ms) 154mm Mandrel • Delta EAF is about 0.003 at alpha of 8, 9
Label: d (mm)-mandrel diameter (mm)-turns-current (mA)-exposure time (ms) Exposure time
LED Spectrum versus drive current • The LED drive current was varied from 5 mA to 10 mA • The peak wavelength varied between 853 nm to 857 nm mainly depending on noise • The shape of the spectrum is almost the same but increasing with drive current • Similar results are obtained for drive currents of 14 mA (not shown)
Second Direct Imaging Improvement • The divergence of light from the multimode fibre and its NA can be so large that the light cannot all fall onto a CCD camera plane conveniently. • If the camera is positioned too close to the fibre it will not be in the far field and if it is too far away it only intercepts part of the far field • As a result the EAF curves calculated are incorrect. • To solve this we are beginning to move the CCD camera using a motorised stage in the x and y directions normal to the fibre axis to record a mosaic of overlapping or adjacent photographs which are then aligned and joined to one another before the calculation of the EAF
Nonlinearity and Noise of CCD • In general, the current from a CCD camera may not be linearly proportional to the intensity of light falling on the CCD • The plot shows the peak optical power received from the MMF by the CCD versus the LED drive current obtained using a 10 m MMF without mandrel at 15 ms exposure time. • To avoid drive current variation effects we usually set a drive current of 6.5 mA for 15 ms exposure to be sufficiently below saturation at the peak optical power while giving a large dynamic range • Strictly we should use this curve to correct the nonlinearity before calculation of the EAF
EAF dependence on CCD nonlinearity due to different LED drive currents and exposure time • Using a 38 mm diameter mandrel with 20, 30, 40 turns at 15 ms exposure time (solid lines) the EAFs of different colours coincide • Using a 38 mm diameter mandrel with 40 turns at 19.55 ms exposure time (dash line) the EAFs coincide but are different to those with 15 ms exposure time.
CCD Camera Dynamic Range • The range of illumination must be adjusted using neutral density filters and LED drive current so that it falls within the range of the CCD ADC. • Otherwise if the light is too intense it will saturate the camera • If the light is too weak the output CCD current will be dominated by dark current noise.
Round Robin • UCL have agreed to take part in measuring the far field of a 2 km and 3 km HPCF multimode fibres on 400 mm diameter reels previously measured and supplied by Takehiro Hayashi, Manabu Kagami and Shigeru Kobayashi, Adamant • The UCL free space CCD measurement technique and algorithms to calculate EAF will be compared to the EAFs found using an f-theta lens followed by commercial software to calculate EAF. • The fibre reels have now been delivered to UCL from Adamant and 2 km fibre measurements have been made.
Parameter values • We had some discussions with HATlab to ensure we used the same parameters in the UCL algorithm calculation procedure. In the V project Synos software • "Analysis Radius Factor" was set to 1.2 • "Analysis Pitch", was set to 1 respectively for the large NA fibre, • “Analysis Pitch” was set to 0.5 or 0.1 for a smaller NA silica fibre • In due course it would be good to specify these parameters in the EAF standard so everyone can obtain the same results.
2 km long multimode fibre far field pattern • 850 nm LED light launched into the fibre, and then detected by f – theta lens FFP measurement system. • The LED drive current was 6.5 mA and exposure time was 1 ms. • The distance from the fibre end to the FFP system was 6 mm.
The f – theta lens measurement system tolerances for EAF of 2 km multimode fibre • The EAF curves obtained depend slightly on the adjustment of the fibre micro-positioner relative to the f – theta lens FFP measurement system
F-theta lens far field measurement system adjusted to show dark and bright spots for 2 km long multimode fibre • A few dark and bright spots appeared on the CCD camera.
EAF of f-theta lens far field measurement system adjusted to show dark and bright spots for 2 km long multimode fibre
F-theta lens far field measurement system adjusted to move bright spot to edge of field of view for 2 km long multimode fibre • By adjusting the micro-positioner the spots could be moved to the edge of the far field image.
EAF of f-theta lens far field measurement system adjusted to move bright spot to edge of field of view for 2 km long multimode fibre
Comparison of EAFs from UCL in black with Toyota published results • The black dashed curve is without angle scaling and the black solid curve is with angle scaling to match the NAs of the 50 micron GI-MMF silica and HPCF fibres. • The results for EAF measured using a mandrel and free space technique agree very well, lying between those of a 2 km and 3 km fibre measured using the f-theta lens technique and a high order mode launch. • Is this angle scaling correct? With a slightly smaller scaling we could place our silica fibre curve between the low order launch and high order launch of the 3 km HPCF.
Equation of ideal EAF • Instead of just drawing an EAF which is the ideal and a template of tolerance around it to define it, it would be better to express the ideal EAF as an equation. • An eighth order harmonic Fourier Series is a good fit to the EAF, the first order derivative of the EAF and the second order derivative of the EAF.
EAF equation for 38 mm mandrel, 20 turns, 15 ms exposure when scaled in angle so that the NA of the silica fibre matches that of the HPCF fibre
Conclusions • The conclusions depend on what tolerance around the EAF curve can be accepted however, we could conclude the following • The EAF found using direct imaging with a CCD camera reaches a stable condition for 10 m of GI silica 50 micron diameter core fibre when the number of turns is the following number or higher Label: d (mm)-mandrel diameter (mm)-turns-current (mA)-exposure time (ms) • 16-32-42- 6.5-15 • 16-38-30-6-15 • 16-58-50-6-15 • 16-66-40-6-15 • 16-154-20-6-15 • Increasing the exposure time from 15 ms to 20.49 ms does not make much difference. • This work needs to be repeated by stepping the camera to make sure the full far field is recorded.
Future Work • Repeat the direct imaging measurement by removing and replacing the fibre to establish an error bar • Measure LED divergence • Measure the Far Field of 3 km long multimode fibre supplied by Takehiro Hayashi, Manabu Kagami, Shigeru Kobyashi and Adamant as part of Round Robin • Compare Far field ideal EAF and near field ideal EF for measuring fibre attenuation • Use CCD camera nonlinearity curve to correct the intensity distribution before calculation of the EAF. • Investigate angle scaling to put silica fibre EAF curves between the low order launch and high order launch of the 3 km HPCF and whether it can be justified.
Actions • The plane to sphere correction factor needs to be put into the document for the direct imaging measurement using a CCD camera and for the pinhole/integrating sphere and single mode fibre/power meter cases if they are moved in an x y plane normal to the fibre axis. • The document needs to be modified to say that if the NA is so large that the far field does not fall on the CCD camera in the Direct imaging using a CCD camera approach the CCD camera must be stepped in x and y to capture the full far field and the photograph mosaic pieced together before calculation of EAF • The following parameters need to be defined and the recommended values given in the document: "Analysis Radius Factor“ and "Analysis Pitch“ as part of the EAF calculation • Once the EAF equations for the ideal EAF are agreed and finalised they should be put into the EAF standard document
References • Manabu Kagami, Akari Kawasaki and Masatoshi Yonemura, “Modal power distribution in short reach optical communications using step-index-type multimode optical fibers”, 3rd IEEE CPMT Symposium Japan (ICSJ), Kyoto, pp 1-4, 11-13 Nov. 2013 • Clapp and Laurie Cahill • Gloge (Bell System Technical Journal 1972-1975 • Gloge Book • Miller and Chenowyth, • Marcatilli
Acknowledgement • Thanks to Mr Andy Moss who lent us an LED, current controller, cleaning swab and solvent • Thanks to Dr Hadi Baghsiahi for locating equipment • Thanks to Kai Wang who offers the windings of 38 mm mandrel to make mode stable • Thanks to Chinese Scholarship Council, CSC for sponsoring the research of the first author and the Faculty of Engineering Sciences for the Dean’s Prize which also sponsors the research of the first author.