Download
1 / 11
110 likes | 113 Views
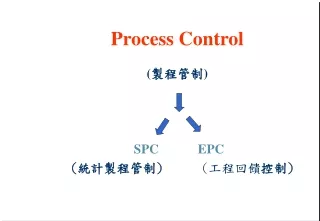
This course covers the fundamentals of process control in distillation systems, including transfer functions, steady-state gain, dynamics, and alternative methods of obtaining transfer functions. It also explores the MIMO case and the importance of transfer matrices in block diagrams. The frequency response and the effect of feedback control on the system are discussed, along with the use of sensitivity functions and bandwidth. Join us to learn how to effectively control distillation processes!

E N D
Process Control Basics Distillation Control Course December 4-8, 2004
yD 0.97 63% 0.96 0.95 time Transfer function: Θ=2 10 50 τ=50 Laplace: Transfer Functions SISO (Single Input Single Output) Steady-state “Increasing L from 1.0 to 1.1 changes yD from 0.95 to 0.97” (for example, run Hysys) Linear process: Gain independent of input magnitude ( L) Dynamics “The response has a dead time of 2 minutes and then rises with a time constant of 50 minutes”
Take laplace of linearized model Response: Xi+1 Xi “gain”=1 τ time Time constant τ=Mi/L Alternative Method of Obtaining Transfer Function: Example L (constant) xi+1 L xi Mi=constant Note: Gain is obtained by using s = 0: “gain” = g(0)
(Time constant 50 min for yD) (time constant 40 min for xB) MIMO (multivariable case) Direct Generalization: “Increasing L from 1.0 to 1.1 changes yD from 0.95 to 0.97, and xB from 0.02 to 0.03” “Increasing V from 1.5 to 1.6 changes yD from 0.95 to 0.94, and xB from 0.02 to 0.01” Steady-State Gain Matrix
1. G(s) is independent of input u! For given u(s) compute output y(s) as Can therefore make block diagrams Important Advantages With Transfer Matrices G(s) u(s) y(s) 2. Frequency Response: G(s), with s=j (pure complex no.) gives directly steady-state response to input sin( t)! u1 g11(s) y1
y1(t) A time u1(t) “Steady-state” frequency response Response (as things settle) A¢ |g11(jw)| P
Tells directly how much a sine of frequency w is amplified by process Note |g11(jw)| (log scale)| |g11| 2 1 0.01 0.02 0.1 =1/50 0.1 Fast sinusoids are “filtered by process (don’t come through BODE PLOT (magnitude only) w (log scale)
Effect of Feedback Control d C(s) G(s) ys u y G(s): process (distillation column) C(s): controller (multivariable or single-loop PI’s) y: output , ys: setpoint for output u: input d: effect of disturbance on output
With feedback control Eliminate u(s) in (1) and (2). Set ys=0 S(S)=“sensitivity function” = surpression disturbances Negative feedback
Small resonance peak (small peak = large GM and PM) τ Log- scale 1 w (log) w B Bandwidth (Feedback no help) 0.1 Slow disturbance d1: 90% effect on y2 removed In practice: Cannot do anything with fast changes, that is, S(jw)= I at high frequency S is often used as performance measure Bandwidth frequency B¼ 1/c c [s] = closed-loop response time