Download
1 / 15
160 likes | 313 Views
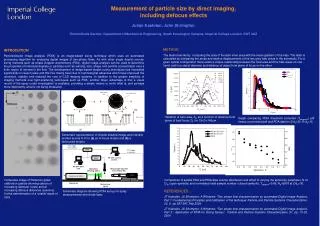
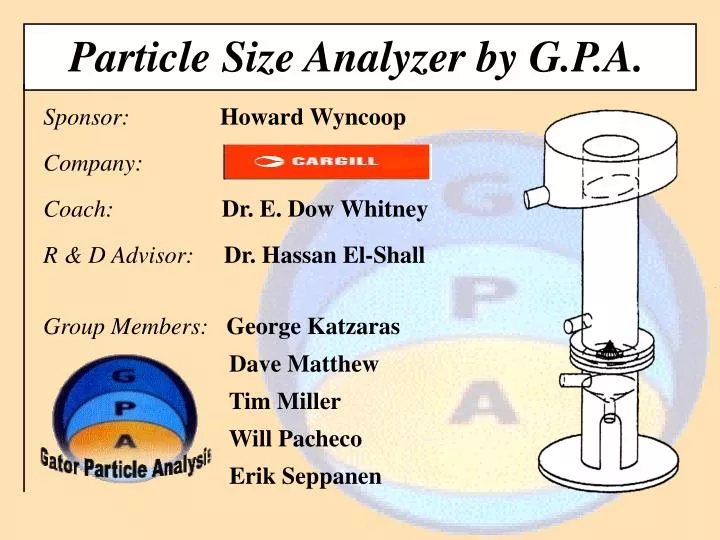
Particle Size Analyzer by G.P.A. Sponsor: Howard Wyncoop Company: Coach: Dr. E. Dow Whitney R & D Advisor: Dr. Hassan El-Shall Group Members: George Katzaras Dave Matthew Tim Miller Will Pacheco

E N D
Particle Size Analyzer by G.P.A. Sponsor: Howard Wyncoop Company: Coach: Dr. E. Dow Whitney R & D Advisor: Dr. Hassan El-Shall Group Members: George Katzaras Dave Matthew Tim Miller Will Pacheco Erik Seppanen
Outline • Background of Mining Process • Objective • Product Specifications • Design Selection • Experimental Plan and Procedure • Results • Analysis • Conclusion • Issues • Future Work
Mining Process Draglines Hydrosizers Flotation
Design and develop particle analysis instrumentation to provide real-time monitoring for continuous process control and optimization of hydrosizers. Problem Statement
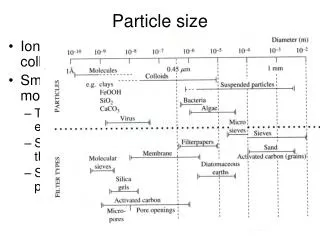
Product Specifications Particle Size Range: Tolerance of all sizes Solid Concentration Range: 0 - 80% Absolute Accuracy: 10% error Size Fraction Output Signal: 4 - 20 mA
Experimental Procedure • Pre-screened and weighed representative samples • Set desired variables • Injected sample • 15 minute run • Collected overflow and underflow particles • Dried samples • Performed screen analysis
Responses of variable interactions Responses of individual variables
Definition of Efficiency • Conceptually, Efficiency is: % of -35M that is going where it should (minus) % of 35M that is not going where it should • The efficiencies for the overflow and underflow are the same. The calculation differentiates between the -35M & 35M only.
Mean Efficiency The mean efficiency for splitting the sample at 35M was: (The figure in parentheses denotes a 95-percent Confidence Interval) 86.99% (+/- 3.71%)
Future Work • Fine-tune variables to increase efficiency • Field Test Dynawhirl at Cargill • Develop instrumentation for automated measurement • Implement Final Product at Cargill • Model and make adaptable for variable sizer stream