Download
1 / 21
210 likes | 368 Views
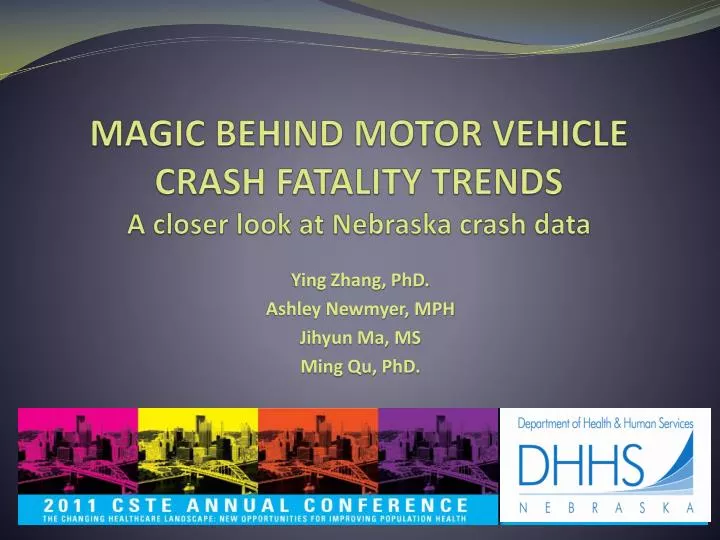
MAGIC BEHIND MOTOR VEHICLE CRASH FATALITY TRENDS A closer look at Nebraska crash data. Ying Zhang, PhD. Ashley Newmyer, MPH Jihyun Ma, MS Ming Qu, PhD. Background.

E N D
MAGIC BEHIND MOTOR VEHICLE CRASH FATALITY TRENDSA closer look at Nebraska crash data Ying Zhang, PhD. Ashley Newmyer, MPH Jihyun Ma, MS Ming Qu, PhD.
Background • Gov. Dave Heineman applauded the safe actions of motorists who contributed to one of the lowest traffic fatality totals on record for the state. The fatality total for 2010 was 186 (updated 190), the second lowest total since recordkeeping began 73 years ago. (www.governor.nebraska.gov, January 1, 2011)
Background • In 2010, about 32,800 people lost their lives due to motor vehicle crashes on the nation’s roads. • The 3 percent decrease from 2009 brings the number of road deaths to the lowest level since the federal government began keeping records in 1949. • Decades of public health interventions aimed at preventing deaths on the nation’s roads are making a difference.
In this study… • To explore factors that possibly contributed to crash fatality decrease Method • Nebraska CODES data including Crash (2000-2010), hospital discharge data (2002-2008) • Trauma registry data (2001-2010) • EMS data (2005-2009) • Variables • Person: age, gender, • Risk factor: alcohol, seat belt • Crash: type, location, time • Trauma care • EMS response
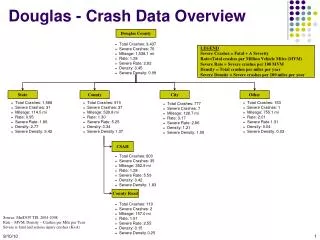
Figure 1 Number of crashes, persons involved, deaths, and VMT by year Nebraska, 2000-2010 * VMT: Vehicle Miles Traveled
Figure 3 Person type distribution of crash fatalitiesNebraska, 2000-2010
Figure 4 Gender distribution of crash fatalitiesNebraska, 2000-2010
Figure 5 Number of crash fatalities by age groupNebraska, 2000-2010
Figure 6 Child restraint & safety belt observedusage rateNebraska, 1999-2010 Provided by : Nebraska Office of Highway Safety, PO Box 94612, Lincoln, NE 68509
Figure 7 Safety belt usage ratevs.death rate per 100 million miles traveledNebraska, 2000-2010 Provided by : Nebraska Office of Highway Safety, PO Box 94612, Lincoln, NE 68509
Figure 8 Percent of people who were in alcohol involved among all crashes and fatal crashes*Nebraska, 2000-2010 * If any driver in a crash was drunk, then all persons in the crash were considered alcohol involved.
Figure 9 Alcohol-related fatalitiesCrash rate per 100 million milesNebraska, 2000-2010 Provided by : Nebraska Office of Highway Safety, PO Box 94612, Lincoln, NE 68509
Figure 10 Driving under the influence (DUI) arrests and convictionsNebraska, 2001-2010
Figure 11 Crash type distribution of crash fatalitiesNebraska, 2000-2010
Figure 12 Location distribution of crash fatalitiesNebraska, 2000-2010
Figure 13 Trauma registry case-fatality rates* by ISS categoryNebraska, 2001-2010 For each ISS category, case-fatality rate=(number of persons died/number of person admitted)*100
Figure 14 Median EMS run time (minutes), Nebraska 2005-2009 From 911 call to EMS arrival at scene From scene to EMS arrival at hospital
Summary • The following factors may have contributed to the decline of crash fatality • Increasing seatbelt usage • Alcohol related crash fatality • Improved trauma care • Faster EMS response, especially at rural areas
Acknowledgment • Fred Zwonecheck, Linda Kearns, Nebraska Office of Highway Safety • Sean Owings, Nebraska Dept. of Roads • Dr. Erick Welsh, Injury Epidemiologist, NDHHS • Dr. Jennifer Marcum, CDC/CSTE Fellow • Qiao Ma, Intern, DHHS