Download
1 / 30
310 likes | 424 Views
Renewable Energy in the Present and the Future. CERN Geneva 23 October 2013. Consequences of fossil energy dependence. The resources are not evenly distributed worldwide Supply security risk Interest to replace imports with indigenous resources Fossil fuels are costly and prices fluctuate

E N D
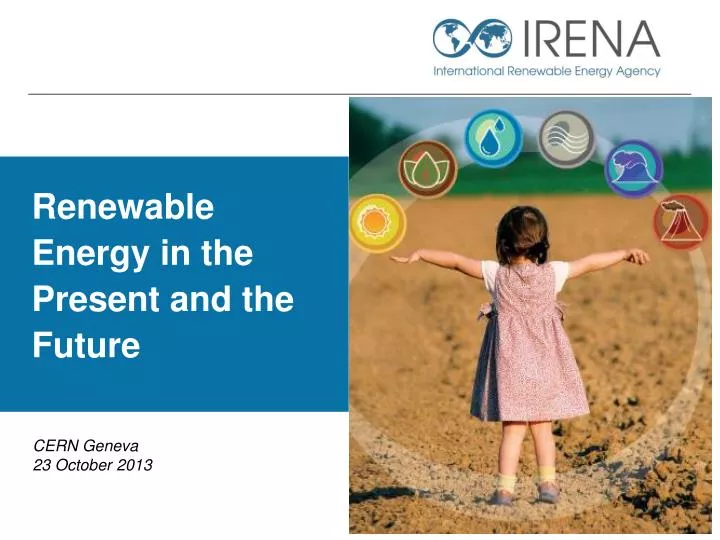
Renewable Energy in the Present and the Future CERN Geneva 23 October 2013
Consequences of fossil energydependence • The resources are not evenly distributed worldwide • Supply security risk • Interest to replace imports with indigenous resources • Fossil fuels are costly and prices fluctuate • Some countries spend more than 10% of GDP on fossil fuel imports • IEA projects that fossil fuel prices will continue to rise • Global shale gas prospects outside US are unclear • Minigrid and offgrid solutions for electrification of remote communities – diesel based power generation is very expensive • Significant local air pollution damages • The latest IPCC report stresses the risk of climate change • Burning of fossil fuels, especially coal, is a prime source of GHG emissions • Renewable energy and energy efficiency are widely accepted as sustainable solutions • UN SE4ALL initiative calls for a doubling of RE share and doubling of efficiency gains by 2030 • IRENA as hub for renewable energy
About IRENA • International Renewable Energy Agency • Established April 2011 • Mission: Accelerate deployment of renewable energy • Scope: Hub, voice and source of objective information for renewable energy • Members: 161 partner countries; 119 ratified members • (global scope) • Mandate: Sustainable deployment of the six RE resources (Biomass, Geothermal, Hydro, Ocean, Solar, Wind) • Structure: Three programmatic divisions CSP, IITC, KPFC • Location: Headquarters in Abu Dhabi, United Arab Emirates • Innovation and Technology Centre IITC, Bonn, Germany • Director-General: Adnan Amin
International Renewable Energy Agency: 119 Member Countries and growing rapidly Members of the Agency Signatories/States in Accession More than 160 partner countries
1 RENEWABLE ENERGY situation and trends
Globally 18% RE in Total Final Energy Consumption in 2010Half is traditional biomass, 8.4% modern renewables Source: Global Tracking Report,2013
Overall share of renewable energy has remained quite flat, albeit some sources grew exponentially from a small base
Growth 1990-2010 by country
About half of the new electricity generation capacity worldwide is based on renewable energyThe share has doubled in recent years • Clean energy market size USD 269 bln/yr (investment) • Nearly double with inclusion of: • Large hydro • End-use sector equipment (heatpumpsetc) • Biofuel feedstock Global capacity additions 2011 41 GW Wind 30 GW Hydropower 30 GW Solar PV <1 GW Solar CSP 5 GW Biomass <1 GW Geothermal Global capacity additions 2012 45 GW Wind 29 GW Hydropower 31 GW Solar PV <1 GW Solar CSP 5 GW Biomass <1 GW Geothermal Installed capacity 1100 GW hydro 300 GW wind 100 GW solar PV 70 GW biomass 15 GW geothermal Source: IRENA
LCOE ranges and averagesRE is cost effective today in many cases
2 Renewable Energy Projections for 2030
(%) SE4ALL target 36 What does it mean to double the RE share? RE share incl. traditional biomass 30 30 % TFEC 9-15% GAP 20 • What does doubling mean? • Today 18% renewables including 9% modern renewables • Business-as-usual 2030: 21% renewables • Target: 30-36% renewables • Gap: 9-15% • 36% renewables – up to half of global GHG reductions (CO2 and CH4) • TFEC = Total Final Energy Consumption • TFEC share covers direct use of renewable energy plus energy and heat from renewable sources • Global Tracking Framework – May 2013 Business as usual 18 10 9 RE share without traditional biomass 2010 2020 2030 12
REMAP Countries: AUSTRALIA BRAZIL CANADA CHINA DENMARK ECUADOR FRANCE GEMANY INDIA INDONESIA ITALY JAPAN MALAYSIA MEXICO MOROCCO NIGERIA RUSSIA SAUDIA ARABIA SOUTH AFRICA SOUTH KOREA TONGA TURKEY UNITED ARAB EMIRATES UNITED KINGDOM UNITED STATES UKRAINE REMAP 2030 - Scope 26 countries representing 75% of global energy demand by 2030 Represents 58% of world population in 2012, 56% in 2030 60% of global PPP in 2012 Country Dialogue is crucial and ongoing Results are aggregated to produce a global cost curve
Reference FF/Nuclear technologies External effects Methodology at a Glance Fuel prices, taxes, subsidies, capital cost Substitution cost IRENA Costing studies Learning curves/cost reduction assessments REMAP Options Cost curves IRENA technology database Sectoral/technology studies Potentials Country Reference Scenarios
The Reference Scenario • Includes all policies in place or likely to be put in place in the coming years • Some countries have scenarios and objectives for 2030, others not • Supplemented by IEA WEO 2012 data • Reference scenario includes efficiency gains • No cost assessment of the reference scenario • Planning framework comparison will be part of the analysis
How to double the RE shareAccess and efficiency can help to double the share
Impact of all REMAP options Combined DRAFT Total renewables grow from: 20% (Ref. 2030) 29.3% (REMAP) Modern renewables grow from: 8.7% (2010) 14.9% (Ref. 2030) 27.3% (REMAP) Traditional biomass declines from 8% to 5% in Ref. 2030 to 2% in REMAP* *assessment imprecise b/c large amount of traditional biomass is consumed outside of REMAP 25 countries
REMAP 25 Cost Curve DRAFT Traditional biomass in Reference Scenario (to be replaced) - from 19.5 to 15 % Growth of modern Renewables from 9 to 15% 353 REMAP Options Weighted Average Substitution Cost= +1.37 USD/GJ TFEC Additional RE Consumption REMAP: 41 EJ/yr Total Annualized Substitution Cost/year 57 Bln (USD 2010) (<1% of 4 trillion total annualized cost for 350 options) REMAP Options – from 15 to 28%
REMAP options - sectoralPower sector represents only one third of total potential DRAFT
How to double the global RE share? • Up to a third RE is possible at approximately zero cost by 2030 • However policies in place yield only 20% RE in 2030 • RE potential is not yet fully reflected in the policy plans and scenarios • Power sector accounts for around 40% of total potential • The role of end use sectors is critical to meet the doubling objective • Sustainable biomass plays a key role, around 60% of total potential • Residues, energy crops, more efficient use of resources • Electrification can increase RE deployment • For example electric vehicles • Technology innovation can push the envelope • More affordable technology • Increase of the RE potential (offshore wind, advanced biofuels, grid integration technology, etc)
3 RE Technology innovation
Bio-refineries Wave Energy Technology Innovation matches new energy market needs with technological solutionsMost innovation is gradual, not disruptive Have Floating Turbines Fully Integrated Residential Solar Technologies http://images.nrel.gov/
Innovation supports wholetechnology life cycle Applied R&D Demonstration Basic R&D Market Development Commercial Diffusion Technology Push Market Pull Standardization ② ① • Patenting/ Licensing RD&D cooperation ③ Enabling technology deployment ④ < Setting enabling Innovation Policy Framework > Source: IRENA (2012)
Standardization across the technology life cycle The Innovation System Technology standards • Reliability and performance of technologies • Demand, market acceptance, investment and uptake of technologies • Technical capacity on testing, certification and reliability in developing countries Demand • Consumers • Energy sector • Government • Exports Supply • Academia • Research centres • Business Market Pull Basic Research Research & Development Demon - stration Commer - cialisation Diffusion Product/ Technology Push Innovation policy frameworks Framework conditions: macro economic stability, education and skills development, innovative business climate, IP protection etc. Technology life cycle Source: - Adapted from IEA - ETP 2008
Standardization – Benefits forcountries • 714 international standards were identified • These are not widely know or deployed • International standards are lacking in some areas • Standards can • Provide a detailed technical basis for laws and regulations • Support public and private tendering processes • Provide insights regarding latest technology developments and best practices • Support technology markets based on sound quality and health & safety (H&S) requirements • Also energy management standards eg ISO 50 001
Patents for RET • The role of patents in RET innovation still needs to be better understood. • Different views – Incentivize / Restrain • Patents seen as an engine for innovation in R&D intensive sectors. Further analysis is still required for RET sector. • Patenting in most renewable energy areas has increased more than five-fold in the last two decades– more than 200 000 patents in place • Few renewable energy patents have been filed outside OECD countries and China IRENA’s Working Paper
Patents can provide additional information on innovation trends Source: WIPO (2011) Cumulative patent families in desalination and renewable energy
Key remarks on RE Patents Source: WIPO (2011)
THANK YOU !www.irena.org Technology Briefs RRA Jobs & Access Project navigator