Download
1 / 1
40 likes | 293 Views
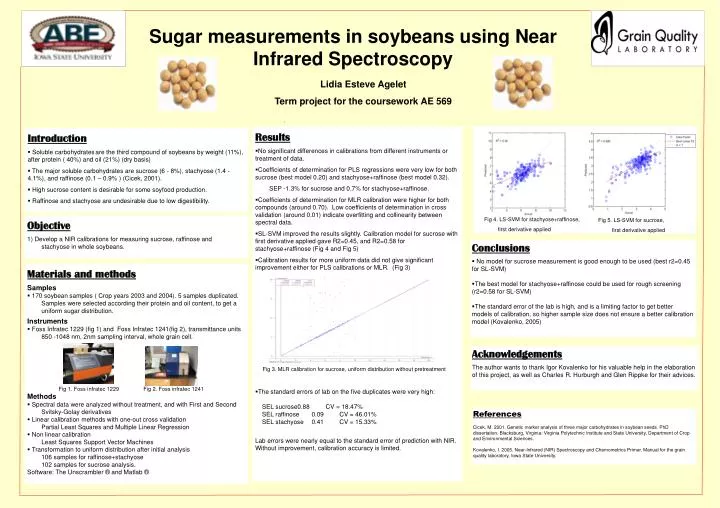
Sugar measurements in soybeans using Near Infrared Spectroscopy. Lidia Esteve Agelet Term project for the coursework AE 569. ,. Results No significant differences in calibrations from different instruments or treatment of data.

E N D
Sugar measurements in soybeans using Near Infrared Spectroscopy Lidia Esteve Agelet Term project for the coursework AE 569 , • Results • No significant differences in calibrations from different instruments or treatment of data. • Coefficients of determination for PLS regressions were very low for both sucrose (best model 0.20) and stachyose+raffinose (best model 0.32). SEP -1.3% for sucrose and 0.7% for stachyose+raffinose. • Coefficients of determination for MLR calibration were higher for both compounds (around 0.70). Low coefficients of determination in cross validation (around 0.01) indicate overfitting and collinearity between spectral data. • SL-SVM improved the results slightly. Calibration model for sucrose with first derivative applied gave R2=0.45, and R2=0.58 for stachyose+raffinose (Fig 4 and Fig 5) • Calibration results for more uniform data did not give significant improvement either for PLS calibrations or MLR. (Fig 3) • The standard errors of lab on the five duplicates were very high: • SEL sucrose 0.88 CV = 18.47% • SEL raffinose 0.09 CV = 46.01% • SEL stachyose 0.41 CV = 15.33% Lab errors were nearly equal to the standard error of prediction with NIR. Without improvement, calibration accuracy is limited. • Introduction • Soluble carbohydratesare the third compound of soybeans by weight (11%), after protein ( 40%) and oil (21%) (dry basis) • The major soluble carbohydrates are sucrose (6 - 8%), stachyose (1.4 -4.1%), and raffinose (0.1 – 0.9% ) (Cicek, 2001). • High sucrose content is desirable for some soyfood production. • Raffinose and stachyose are undesirable due to low digestibility. Objective 1) Develop a NIR calibrations for measuring sucrose, raffinose and stachyose in whole soybeans. Fig 4. LS-SVM for stachyose+raffinose, first derivative applied Fig 5. LS-SVM for sucrose, first derivative applied • Conclusions • No model for sucrose measurement is good enough to be used (best r2=0.45 for SL-SVM) • The best model for stachyose+raffinose could be used for rough screening (r2=0.58 for SL-SVM) • The standard error of the lab is high, and is a limiting factor to get better models of calibration, so higher sample size does not ensure a better calibration model (Kovalenko, 2005) • Materials and methods • Samples • 170 soybean samples ( Crop years 2003 and 2004). 5 samples duplicated. Samples were selected according their protein and oil content, to get a uniform sugar distribution. • Instruments • Foss Infratec 1229 (fig 1) and Foss Infratec 1241(fig 2), transmittance units 850 -1048 nm, 2nm sampling interval, whole grain cell. Fig 1. Foss infratec 1229 Fig 2. Foss infratec 1241 • Methods • Spectral data were analyzed without treatment, and with First and Second Svitsky-Golay derivatives • Linear calibration methods with one-out cross validation Partial Least Squares and Multiple Linear Regression • Non linear calibration Least Squares Support Vector Machines • Transformation to uniform distribution after initial analysis 106 samples for raffinose+stachyose 102 samples for sucrose analysis. Software: The Unscrambler ® and Matlab ® • Acknowledgements The author wants to thank Igor Kovalenko for his valuable help in the elaboration of this project, as well as Charles R. Hurburgh and Glen Rippke for their advices. Fig 3. MLR calibration for sucrose, uniform distribution without pretreatment . References Cicek, M. 2001. Genetic marker analysis of three major carbohydrates in soybean seeds. PhD dissertation. Blacksburg, Virginia: Virginia Polytechnic Institute and State University, Department of Crop and Environmental Sciences. Kovalenko, I. 2005. Near-Infrared (NIR) Spectroscopy and Chemometrics Primer. Manual for the grain quality laboratory, Iowa State University.