Download
1 / 13
130 likes | 230 Views
Seasonal variations in SAGE II background aerosols in the upper troposphere and lower stratosphere. 2 Sep, 2007. SAGE II 論文の要点まとめ 庭野 将徳. Stratospheric Background Aerosol (SBA) - Mean Vertical profiles of SBA:

E N D
Seasonal variations in SAGE II background aerosols in the upper troposphere and lower stratosphere 2 Sep, 2007 SAGE II 論文の要点まとめ 庭野 将徳
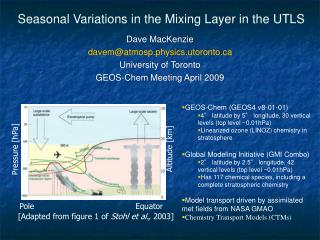
Stratospheric Background Aerosol (SBA) - Mean Vertical profiles of SBA: • Vertical decrease in the number of particles at larger mode in the lower stratosphere [Thomason & Peter, 2006] • Vertical decrease of the amount of carbonaceous aerosols in the lower stratosphere [Murphy et al., 2007] => How is the vertical profile of SAGE II Reff ? - Seasonal cycle in SBA: [Hitchman et al., 1994] • Above 26 km, the enhanced uplift of aerosols in summer with the suppressed uplift or horizontal mixing in winter (contrast of winter vs summer) • At 16-22 km, rapid horizontal transport and mixing => How is the role of microphysics and dynamics ? (Also how is the hemispheric difference and tropical variations ?)
Aerosol formation in tropical upper troposphere (TUT) - In UTU, cold temperature, much water in the cloud region => • Aerosol formation: the production of OH, and consequently of gaseous H2SO4 • Aerosol loss: the uptake of gaseous H2SO4 & SO2, and the homogeneous freezing of aerosol particles to form cirrus clouds However, the horizontal distribution of aerosols on the whole global in UTU is still unclear …
↑ Pi ↑ Rev ↑ Ruiz ↑ El Reventador (Nov 2002) 3.1. Time variation bl, a & Reff (2.5S-N) at 24 km (Fig.1) • Before Pinatubo: b & Reff are larger than those in 2000-2003 • After Pinatubo: -1998~ for b0.452 &b0.525 -2000~ for b1.02, a & Re => use data for 1998-2004 to remove interannual variability
3.2. Seasonal Cycle • Seasonal Amplitude (Fig.2) • Large amplitude > 15% 1) at 45S-40N above 26 km 2) at 14-21km & 15S-30N 3) over high latitudes above 18 km 4)Below 14 km in subtropics to mid-latitudes -> 1), 2) のみ注目 b0.452 (%) Reff (%)
Seasonal Amplitude (Fig.2) Hemispheric Asymmetry, & a comparison with qw : - Above 26 km, large in SH for b, but in NH for qw - Below 20 km: larger in NH for b (& qw from other study) b0.452 (%) qw (ppmv) Reff (%)
Min In late spring Min In late winter 30 km • Climatological b0.452 (Fig. 3) 20-30S 5S-SN 20-30N Max In early winter Max In early winter Min In Apr-Aug Min In Apr-Aug Min In Apr-Aug 18 km • 30 km: be out-of-phase between NH & SH • 18 km: be in-phase between NH, Eq, and SH
km 32 16 0 E0.452 (Fig. 4) 1. Peak value and altitude over tropics decrease toward higher latitudes Jan Apr 2.Decline of isolines from winter to spring (most robust in spring-summer) 3. Very small value at 20-30o below 16 km in winter-spring Jul Oct 90S Eq 90N
Reff(mm) (Fig. 5) km • Reff value ranges in 0.19-0.20 below 28 km 32 16 0 small large • vertical decrease ~26km: steadily exists even in 2000-2003 • A isoline gap depelops with the isoline declinefrom local fall to winter, and is prominent in local winter-spring
Dry Wet Small values Large values E0.452 & Reff over 10S-N (Fig.6) 32 24 16 - + • E0.452: Tape recorder signal up to 24 km (qw~32 km), • E0.452,qw :in phase km - + + - Jan Jan • Reff &E0.452: the uplift of isoline in Jan-Mar, anomalies in Jan-Jun & Jun-Jan • E0.452: Phase reversal at the peak altitude (28 km)
Month-altitude sections of E0.452 (Fig.7) km 30 20 10 + - + - • Above 26 km, the decline of E0452 peak altitude in local fall-spring (28-23 km in SH, 27-24 km in NH) => larger decline in SH ! => larger amplitude of E in SH • Negative in local winter-summer & positive in local summer-winter at 30 km • Downward propagation of positive/negative anomalies down to 26 km
Upward phase propagation onlyin NH • Below 16 km:a negativein local winter • Month-altitude sections of E0.452 (Fig.7) 20-30S 20-30N km 30 20 10 negative negative positve negative negative positve • At 16-18 km: a negative in Mar-Jul both in NH & SH with large amplitude in NH
Horizontal map of b0.452 at 14 km(Fig. 8) Feb H H • Very small value of b in the winter subtropics at 14km • Corresponding to anti-cyclonic outflow from convective area Aug • Summer value: larger value than winter value H H