Download
1 / 51
510 likes | 689 Views
Manchester University Tiny Network Element Monitor (MUTiny NEM) A Network/Systems Management Tool Dave McClenaghan, Manchester Computing George Neisser, Manchester Computing. 1. Introduction . MUTiny Overview. - Runs on commodity hardware. - Coded in Perl, Perl/Tk.

E N D
Manchester University Tiny Network Element Monitor(MUTiny NEM) • A Network/Systems Management Tool • Dave McClenaghan, Manchester Computing • George Neisser, Manchester Computing
1. Introduction.MUTiny Overview. • - Runs on commodity hardware. • - Coded in Perl, Perl/Tk. • - Easy to install, use and maintain. • - Free (unsupported) to academia. • - Subject to ongoing development.
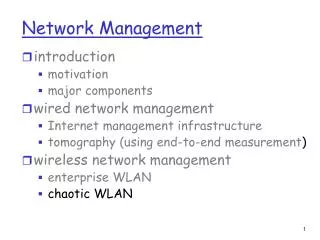
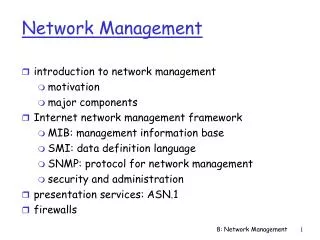
Network Management Overview.NMS Components: • - A Manager, running NM applications. • - A set of managed nodes. • (The managed domain) • - Defined management information (MIBs). • - A Network Management protocol (SNMP).
2. The MUTiny NM Model. • Platform: • PC (Running Linux). • Description: • A Network/Systems Management tool. • Coded entirely in Perl and Perl/Tk.
MUTiny Applications. • - A Network Element Monitor/Manager. • - A Unix Systems Monitor/Manager. • - A MIB data collection and reporting tool.
MUTiny NM Applications. • - Graphically display the domain topology. • - Monitor and report node status changes.
MUTiny NM Applications (continued). • - Display monitored node information. • - Collect and report network statistics.
MUTiny Network Management. Key areas: - Domain Management. - Event Management. - Network Statistics.
MUTiny NEM front end. • _menu bar • _host attributes • _domain status • _topology display • _session bar The GUI
2.1 Domain Management.The Managed Domain. The set of all monitored nodes. • Monitored Node. • Any network device, router, switch, etc. • That is regularly polled for management • information.
Domain Topology Display. • ICMP Status • (Background) • Green OK. • Red No Echo. • Amber Problem. • Clear Unknown.
Domain Topology Display. • SNMP Status • (Foreground) • Black OK. • Blue No SNMP. • Grey Unknown.
Topology Management. • The initial domain topology display
Topology Management. • Add Node Window • - No Auto-Discovery, nodes added by choice.
Topology Management. • - Node and ‘path’ nodes are added to the display.
Topology Management. • - Path is determined by traceroute.
Topology Management. • Change Symbol/Label Window
Connectivity Status Polling. • ICMP connectivity determined by ping. • SNMP connectivity determined by sysUpTime.
Configuring Status Poll Parameters. • Figure 2.2a Interface Polling Parameters
Configuring Status Poll Parameters. • Figure 2.2b General Polling Parameters • - Fully configurable polling. • - Poll ‘Back Off’ options.
4.2 Event Management.Event Definition. • 2.2 Event Management • Connectivity Events. • ICMP:Node_No_Echo • ICMP:Node_OK • ICMP:Node_Problem • ICMP:Status_Unknown • SNMP:No_Response • SNMP:OK • SNMP:Status_Unknown
Network Event Logging. • Figure 2.3a Network Event Log Window
Network Event Alarms. • Figure 2.3b • A Pop-Up Alarm • Pop-Ups may be accompanied with an optional Audible_Alarm (bell).
Event/Action Management.* • Event Configuration Window
Event/Action Management.* • Event/Source Configuration Window
Event Time Frames. • Contact/Frame Configuration Window
2.3 Network Statistics.MIB Data Collection. • Figure 2.4 MIB Data Collection Mechanism • Data stored in: • */nemdata/mibdata/<yearmon>/<Datafile>
Data Storage. • Time Object Value PI • 953036400 ifOutOctets.6 84118 60 • 953036400 ifOutOctets.7 13275 60 • 953037000 ifInOctets.8 7219 60 • 953037000 ifInOctets.5 14303 60 • 953037000 ifInOctets.6 18287 60 • Sample data stored in: • */nemdata/mibdata/200002/gw-site
Configuring MIB Data Collection. • Figure 2.5a • Collection Configuration Window
Node Data Collection. • Figure 2.5b Node Collection Window
Node Data Collection.The Storage Interval. • A multiple of the sampling-interval, eg. • samp-int = 60 seconds • store-int = 15 min • - This greatly reduces the amount of • disk space required to store the data • ( by a factor of 15 in this case ).
Node Data Collection.The Store-Identifier. • The store-id, if set, stores object-id as: • <mib-obj>.<store-id> • eg. ifInOctets.Liv3 • - Useful if instance-id prone to change.
Node Data Collection. • Test Collection Window
‘Change Control’.* • ‘Anchors’collection to IP_addr or Phys_addr
Reporting Network Statistics. • Figure 4.11 The Reporting Mechanism. • The reports are generated from user-defined • Report Parameter Files (RPF’s). • # nemReport -r my.rpf
Reporting Network Statistics. • The Report Template.
Reporting Network Statistics. • Figure 4.12b • Sample ‘Fixed Column’ Report • - Variable and graphical* formats supported.
4.4 Monitoring MUTiny. • Figure 4.14 • The Host System Attributes Area • nemNEMPoll self checks: • - NEM Processes. • - Host system metrics.
MUTiny Self Monitoring. • NEM Self Monitor Configuration Window
3. WWW Cache Status Monitoring.3.1 Caching Service Configuration. • Figure 3.1 • The Operation of the UK National • JANET Caching Service
3.2 Caching Service Operation. • Need to know for each node: • - Network accessibility. • - CPU loading. • - Memory utilisation. • - Disk utilisation. • - Squid application status.
Network Accessibility. • Figure 3.2 Manchester Main Window
System Metric Monitoring. • Figure 3.3 Manchester Cache Systems Window
System Metric Monitoring. • Display indicates: • - If the machine is pingable. • - If SNMP is operational. • - The CPU loading. • - Memory utilisation. • - Disk utilisation. • - Critical process status ( squid ).
System Metric Monitoring.Prerequisites. • The UCD-SNMP mechanism • The monitored host must be running the • UCD-SNMP agent software.
System Metric Monitoring. • System Polling Configuration Window
System Metric Monitoring. • Disk Statistics Window
System Metric Monitoring. • A Pop_Up Alarm • Optional Audible_Alarm (bell).
System Metric Monitoring. • Figure 5.5b • Domain Status Section • Indicates most critical entry in each column.
Real Time Metrics. • ‘top’ Metric Window