Download
1 / 18
260 likes | 617 Views
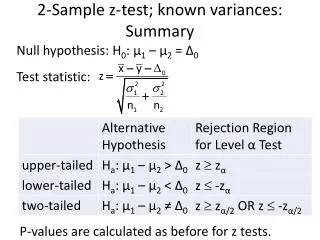
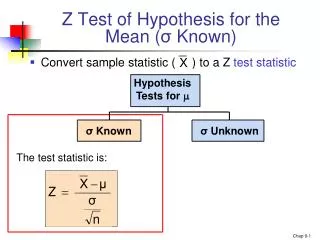
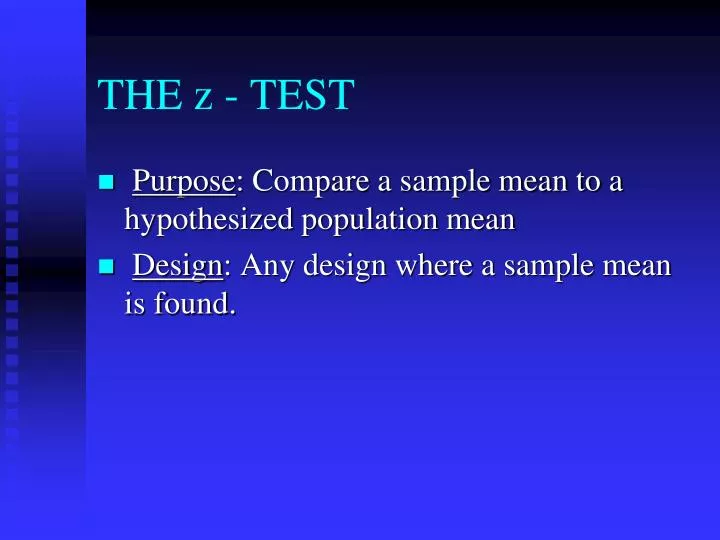
THE z - TEST. Purpose : Compare a sample mean to a hypothesized population mean Design : Any design where a sample mean is found. Assumptions. 1. Independent observations 2. Normal population (or large N) 3. Population s is known. 4. Interval or ratio level data. How it Works.

E N D
THE z - TEST • Purpose: Compare a sample mean to a hypothesized population mean • Design: Any design where a sample mean is found.
Assumptions 1. Independent observations 2. Normal population (or large N) 3. Population s is known. 4. Interval or ratio level data.
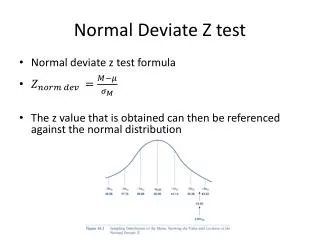
How it Works • Where does your sample mean fall in the sampling distribution? • The sampling distribution is made up of the sample means you would get if the Ho is true.
How it Works • If your sample mean is fairly typical (in the middle) for a population where the Ho is true, then fail to reject Ho. • If your sample mean is very unusual (on the tail of the distribution) for a population where the Ho is true, then reject Ho.
typical unusual
One-Tailed Test • Direction of difference is predicted. • Set a critical value on one tail of the sampling distribution. • If the observed statistic meets or beats the critical value, the test is significant and Ho is rejected.
one-tailed upper 5% z-crit
Two-Tailed Test • Direction of difference is not predicted. • Set two critical values, one on each tail of the sampling distribution. • If the observed statistic meets or beats either critical value, the test is significant and Ho is rejected.
two-tailed lower 2.5% upper 2.5% z-crit z-crit
Comparing One- and Two-Tailed • One-tailed is more powerful. • Two-tailed can be significant in either direction. • If you hypothesize in the wrong direction one-tailed, it can’t be significant no matter how big the difference.
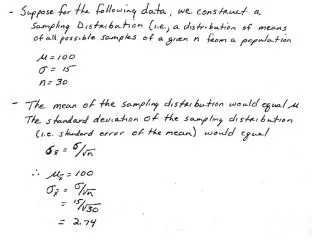
Example A standardized achievement test has a mean of 50 and a population standard deviation of 14. My class of 49 people got a mean of 56 on the test. Is this sample mean significantly different from the population mean?
STEP 3: Find the critical value of z. For one-tailed, a = .05, z-crit = 1.65 For two-tailed, a = .05, z-crit = 1.96
STEP 4: Compare z to z-critical. If z is equal to or greater than z-crit, it is significant. (For 2-tailed tests, ignore the sign). z = 3.00, z-crit (2 tailed) = 1.96 Reject Ho; significant
APA Format Sentence A z-test showed that the mean of the class was significantly different from the mean of the population, z = 3.00, p < .05.