Download
1 / 14
140 likes | 350 Views
Surface Comparison and Validation Metric. Christine Xu University of North Carolina at Chapel Hill. Motivation. Segmentation comparison Shape Statistics: compare two group means. Volume Overlap. Dice coefficient

E N D
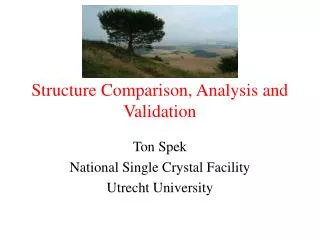
Surface Comparison and Validation Metric Christine Xu University of North Carolina at Chapel Hill MIDAG tutorial - MeshValmet, Christine Xu
Motivation • Segmentation comparison • Shape Statistics: compare two group means MIDAG tutorial - MeshValmet, Christine Xu
Volume Overlap • Dice coefficient • For segmentation X and Y, the coefficient may be defined as shared information (intersection) over the average of the X and Y volumes: • What is the range of Dice coefficient? MIDAG tutorial - MeshValmet, Christine Xu
Volume Overlap Measurement • Pros • straightforward, easy to understand and compute • Cons • Value depends on the amount of boundary exposed • Missing important local shape information Scenario 1 Scenario 2 MIDAG tutorial - MeshValmet, Christine Xu
Boundary Distance Measurement • Between what? • Ideally, corresponding boundary points • Normally, closest points • Interpoint distances for two sets, S and • Thus union over both sets: d(S, ) and d( , S) MIDAG tutorial - MeshValmet, Christine Xu
Boundary Distance Measurement • Pros: • detailed, capture all local shape information • Cons: • Too much information: a very long distance vector 2/11/11 MIDAG tutorial - MeshValmet, Christine Xu 6
Reportable Values • Histogram • The distribution of surface-to-surface distances • Mean • Standard deviation • Quantiles • Divide ordered data into q essentially equal-sized subsets, the kth q-quantile is the value x such that: • The 10-quantiles are called deciles • The 100-quantiles are called percentiles • The nth percentile is the smallest number that is greater than n% of the whole dataset MIDAG tutorial - MeshValmet, Christine Xu
Reportable Quantiles • Hausdorff distance: 100% quantile • Con: reflects really weird points • 95th percentile • More or less what we wanted Hausdorff to tell us • Quartiles • 75th percentile is conservative • 50th percentile: the median • Often more representative central value than the mean • More robust than the mean 2/11/11 MIDAG tutorial - MeshValmet, Christine Xu 8
MeshValmet MIDAG tutorial - MeshValmet, Christine Xu
MeshValmet • A tool that measures surface-to-surface distance between two triangle meshes using user-specified uniform sampling • Finer sampling: more accuracy • Sparser sampling: faster, rough feeling of error distribution • Can be run in GUI mode or batch mode • Provide histogram and statistical information • 3D visualization of surface distances • Based on the code and paper of: MESH: Measuring Errors between Surfaces using the Hausdorff distance (ICME 2002) by Nicolas Aspert. MIDAG tutorial - MeshValmet, Christine Xu
MeshValmet • Documentation (pdf): • Google ‘MeshValmet’ or: • http://www.cs.unc.edu/~xushun/MeshValmet3.0.pdf • Windows and Linux executables: • Windows: http://www.cs.unc.edu/~xushun/MeshValmet-3.0-Windows.zip • Linux:http://www.cs.unc.edu/~xushun/MeshValmet-3.0-Linux.tar.gz • Any questions or bugs, please report to me at: xushun@cs.unc.edu. MIDAG tutorial - MeshValmet, Christine Xu
Usage of MeshValmet • Step 1. Load in two triangle meshes. Key ‘t’ and ‘j’ to switch between the ‘trackerball’ and ‘joystick’ mode in two display windows. • Step 2. Specify sampling step and minimum sampling frequency used for sub-sampling. • Step 3. Choose A->B or B-> or both. This is due to the asymmetric property of Hausdorff distance. • Step 4. Choose the number of bins of the resulting histogram. • Step 5. Choose either signed distance error or absolute distance error. Positive: outward distance; negative: inward distance • Step 6. Click button ‘Compute Error’ • Step 7. (optional) Change settings in the ‘Colormap Control’ panel • Step 8. (optional) Change settings in the ‘Histogram Control’ panel • Step 9. View the statistical results of the comparison. MIDAG tutorial - MeshValmet, Christine Xu
Statistics in MeshValmet • Sample Err Mean: • Sample Err STD: • Face Err Mean: • Face Err RMS: • Hausdorff: • MSD: • MAD: MIDAG tutorial - MeshValmet, Christine Xu
Alternative: CompareBYU • Pros: • Provides volume overlap of two surfaces • Reads BYU-formatted input files - triangles or quads • Cons: • Runs only on the command line and has no GUI • Do not provide user-specified uniform sampling • Only computes error on original vertices in the ‘BYU’ files (if the triangle tiles in the mesh are not all the same size, the measures reported are not accurate enough) MIDAG tutorial - MeshValmet, Christine Xu