Download
1 / 10
170 likes | 591 Views
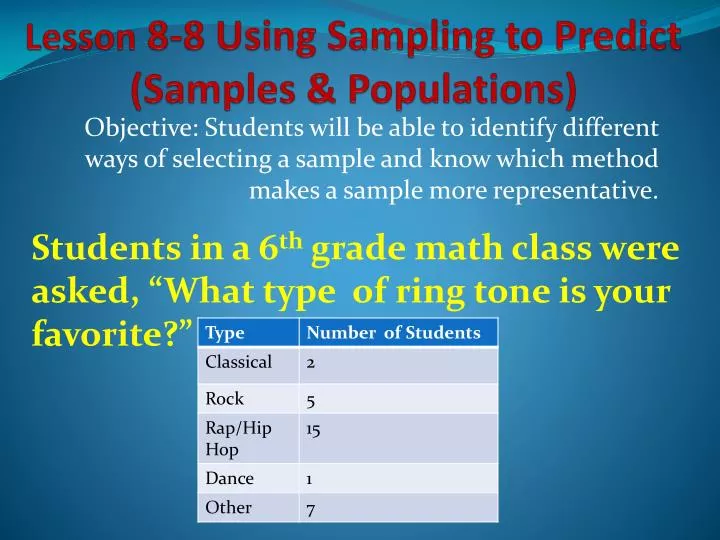
Lesson 8-8 Using Sampling to Predict (Samples & Populations). Students in a 6 th grade math class were asked, “What type of ring tone is your favorite?”. Objective: Students will be able to identify different ways of selecting a sample and know which method makes a sample more representative.

E N D
Lesson 8-8 Using Sampling to Predict(Samples & Populations) Students in a 6th grade math class were asked, “What type of ring tone is your favorite?” Objective: Students will be able to identify different ways of selecting a sample and know which method makes a sample more representative.
What type of ring tone is your favorite If the entire school was surveyed would you expect to get similar results? Could the results from the survey be used to make predictions about ring tone preferences of all students in the United States? Would the predictions apply to “everyone” in the United States?
In statistics a population is the entire group of people or objects that you want information about. However it is not always possible to survey EVERYONE in a population, so statisticians frequently use a sample instead. (A sample is a smaller group that should be representative of the population.) Population Sample United States citizens Registered voters California residents Homeowners 6th grade students in the U.S. 6th grade students at JMS For a survey to be valid, a sample must be chosen very carefully. An unbiased sample is selected so that it is representative of the entire population.
Unbiased Sample A sample representative of the entire population. Example 1: You want to determine what kind of musical ring tones people typically use. You ask every 10th person entering a mall. Does the result represent the entire population? Yes, people of all ages and backgrounds are more likely to be represented. The sample is an unbiased random sample
Simple Random Sample A simple random sample is the most common type of an unbiased sample. In a Simple Random Sample any person in the population is as likely to be chosen as any other. Example: A survey to determine the favorite movie of students at Jacobsen Middle School is being taken. The names of all the students at JMS are placed in a jar and names are pulled out without looking.
Biased Sample: A sample that is NOT representative of the population from which it is selected. Example 1: You want to determine what kind of musical ring tones people typically use. You survey the listeners of a rock radio station. Does the result represent the entire population? No, listeners of a rock radio station will probably prefer rock music ring tones! Your survey is a BIASED SAMPLE.
In a biased sample, one or more parts of the population are favored over others. Two examples of biased samples are: Convenience Sample: A convenience sample includes members of a population that are easily accessed. To determine the favorite movie of students at JMS, Mrs. Ortega surveys the students in Mrs. Burris’ 3rd period math class. Voluntary Response Sample: A voluntary response sample involves only those who want to participate in the sampling. Students at JMS who wish to express their opinion on their favorite movie are asked to complete a survey online.
Determine whether to following conclusion is valid. Justify your answer. Listeners of Rush Limbaugh’s radio show are asked to call in and indicate their preference for the presidential elections. 87% of the listeners who responded preferred the Republican candidate, so the radio station announced that most people prefer the Republican candidate for the next election. The conclusion is NOT valid. The population is restricted to the listeners of the radio station. It is a voluntary response sample, and is biased. The results of a voluntary response sample do not necessarily represent the entire population.
The student council at a new middle school surveyed 5 students from each of the 10 homerooms to determine what mascot students would prefer. The results are shown in the table. If there are 375 students at the school, predict how many students prefer a bulldog as the school mascot. First determine if the sample is valid: The sample is an unbiased random sample since students were randomly selected. Thus, the sample is VALID. Next: determine the percent of the students in the sample that prefer the bulldog. 15+28+7= 50 (total in sample) 28 chose bulldog. Percent is the part over the whole: 28 50 = .56 or 56% 375 Now find 56% of 210 .56 x 375=
Homework Pg 440 pblms 1-3 all Skills Practice 8-8 Pblms 1-6 all