Download
1 / 1
10 likes | 114 Views
Table 1 Median concentrations and concentration ranges at the FNS site during the LBA/CLAIRE/SMOCC-2002 campaign. Data for PM, OC, EC and BC are in µg.m –3 ; for all other species in ng.m –3 . Fine size fraction Coarse size fraction

E N D
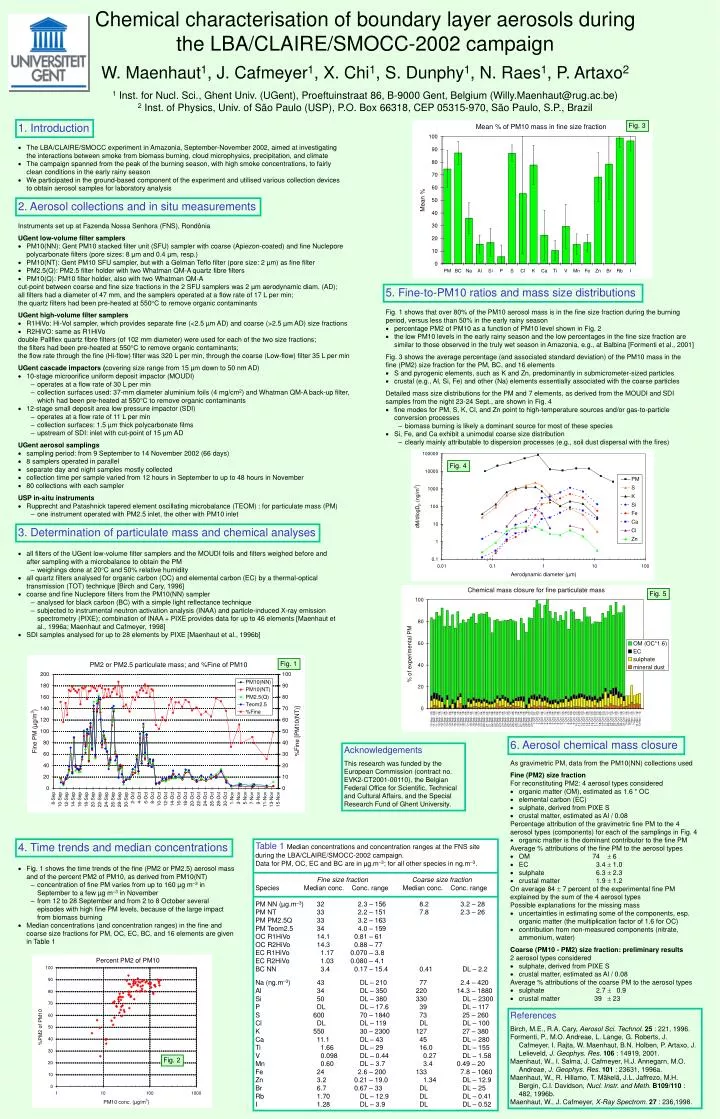
Table 1 Median concentrations and concentration ranges at the FNS site during the LBA/CLAIRE/SMOCC-2002 campaign. Data for PM, OC, EC and BC are in µg.m–3; for all other species in ng.m–3. Fine size fraction Coarse size fraction Species Median conc. Conc. range Median conc. Conc. range PM NN (µg.m–3) 32 2.3 – 156 8.2 3.2– 28 PM NT 33 2.2– 151 7.8 2.3– 26 PM PM2.5Q 33 3.2 – 163 PM Teom2.5 34 4.0 – 159 OC R1HiVo 14.1 0.81 – 61 OC R2HiVo 14.3 0.88 – 77 EC R1HiVo 1.17 0.070 – 3.8 EC R2HiVo 1.03 0.080 – 4.1 BC NN 3.4 0.17 – 15.4 0.41 DL – 2.2 Na (ng.m–3)43 DL –210 77 2.4 –420 Al 34 DL –350 220 14.3 –1880 Si 50 DL –380 330 DL –2300 P DL DL –17.6 39 DL –117 S 600 70–1840 73 25 –260 Cl DL DL –119 DL DL –100 K 550 30–2300 127 27 –380 Ca 11.1 DL –43 45 DL –280 Ti 1.66 DL –29 16.0 DL –155 V 0.098 DL –0.44 0.27 DL –1.58 Mn 0.60 DL –3.7 3.4 0.49 –20 Fe 24 2.6 –200 133 7.8 –1060 Zn 3.2 0.21 –19.0 1.34 DL –12.9 Br 6.7 0.67 –33 DL DL –25 Rb 1.70 DL –12.9 DL DL –0.41 I 1.28 DL –3.9 DL DL –0.52 Chemical characterisation of boundary layer aerosols during the LBA/CLAIRE/SMOCC-2002 campaign W. Maenhaut1, J. Cafmeyer1, X. Chi1, S. Dunphy1, N. Raes1, P. Artaxo2 1 Inst. for Nucl. Sci., Ghent Univ. (UGent), Proeftuinstraat 86, B-9000 Gent, Belgium (Willy.Maenhaut@rug.ac.be) 2 Inst. of Physics, Univ. of São Paulo (USP), P.O. Box 66318, CEP 05315-970, São Paulo, S.P., Brazil 1. Introduction Fig. 3 The LBA/CLAIRE/SMOCC experiment in Amazonia, September-November 2002, aimed at investigating the interactions between smoke from biomass burning, cloud microphysics, precipitation, and climate The campaign spanned from the peak of the burning season, with high smoke concentrations, to fairly clean conditions in the early rainy season We participated in the ground-based component of the experiment and utilised various collection devices to obtain aerosol samples for laboratory analysis 2. Aerosol collections and in situ measurements Instruments set up at Fazenda Nossa Senhora (FNS), Rondônia UGent low-volume filter samplers • PM10(NN): Gent PM10 stacked filter unit (SFU) sampler with coarse (Apiezon-coated) and fine Nuclepore polycarbonate filters (pore sizes: 8 µm and 0.4 µm, resp.) • PM10(NT): Gent PM10 SFU sampler, but with a Gelman Teflo filter (pore size: 2 µm) as fine filter • PM2.5(Q): PM2.5 filter holder with two Whatman QM-A quartz fibre filters • PM10(Q): PM10 filter holder, also with two Whatman QM-A cut-point between coarse and fine size fractions in the 2 SFU samplers was 2 µm aerodynamic diam. (AD); all filters had a diameter of 47 mm, and the samplers operated at a flow rate of 17 L per min; the quartz filters had been pre-heated at 550C to remove organic contaminants UGent high-volume filter samplers • R1HiVo: Hi-Vol sampler, which provides separate fine (<2.5 µm AD) and coarse (>2.5 µm AD) size fractions • R2HiVO: same as R1HiVo double Pallflex quartz fibre filters (of 102 mm diameter) were used for each of the two size fractions; the filters had been pre-heated at 550C to remove organic contaminants; the flow rate through the fine (Hi-flow) filter was 320 L per min, through the coarse (Low-flow) filter 35 L per min UGent cascade impactors (covering size range from 15 µm down to 50 nm AD) • 10-stage microorifice uniform deposit impactor (MOUDI) • operates at a flow rate of 30 L per min • collection surfaces used: 37-mm diameter aluminium foils (4 mg/cm2) and Whatman QM-A back-up filter, which had been pre-heated at 550C to remove organic contaminants • 12-stage small deposit area low pressure impactor (SDI) • operates at a flow rate of 11 L per min • collection surfaces: 1.5 µm thick polycarbonate films • upstream of SDI: inlet with cut-point of 15 µm AD UGent aerosol samplings • sampling period: from 9 September to 14 November 2002 (66 days) • 8 samplers operated in parallel • separate day and night samples mostly collected • collection time per sample varied from 12 hours in September to up to 48 hours in November • 80 collections with each sampler USP in-situ instruments • Rupprecht and Patashnick tapered element oscillating microbalance (TEOM) : for particulate mass (PM) • one instrument operated with PM2.5 inlet, the other with PM10 inlet 5. Fine-to-PM10 ratios and mass size distributions Fig. 1 shows that over 80% of the PM10 aerosol mass is in the fine size fraction during the burning period, versus less than 50% in the early rainy season • percentage PM2 of PM10 as a function of PM10 level shown in Fig. 2 • the low PM10 levels in the early rainy season and the low percentages in the fine size fraction are similar to those observed in the truly wet season in Amazonia, e.g., at Balbina [Formenti et al., 2001] Fig. 3 shows the average percentage (and associated standard deviation) of the PM10 mass in the fine (PM2) size fraction for the PM, BC, and 16 elements • S and pyrogenic elements, such as K and Zn, predominantly in submicrometer-sized particles • crustal (e.g., Al, Si, Fe) and other (Na) elements essentially associated with the coarse particles Detailed mass size distributions for the PM and 7 elements, as derived from the MOUDI and SDI samples from the night 23-24 Sept., are shown in Fig. 4 • fine modes for PM, S, K, Cl, and Zn point to high-temperature sources and/or gas-to-particle conversion processes • biomass burning is likely a dominant source for most of these species • Si, Fe, and Ca exhibit a unimodal coarse size distribution • clearly mainly attributable to dispersion processes (e.g., soil dust dispersal with the fires) Fig. 4 3. Determination of particulate mass and chemical analyses • all filters of the UGent low-volume filter samplers and the MOUDI foils and filters weighed before and after sampling with a microbalance to obtain the PM • weighings done at 20C and 50% relative humidity • all quartz filters analysed for organic carbon (OC) and elemental carbon (EC) by a thermal-optical transmission (TOT) technique [Birch and Cary, 1996] • coarse and fine Nuclepore filters from the PM10(NN) sampler • analysed for black carbon (BC) with a simple light reflectance technique • subjected to instrumental neutron activation analysis (INAA) and particle-induced X-ray emission spectrometry (PIXE); combination of INAA + PIXE provides data for up to 46 elements [Maenhaut et al., 1996a; Maenhaut and Cafmeyer, 1998] • SDI samples analysed for up to 28 elements by PIXE [Maenhaut et al., 1996b] Fig. 5 Fig. 1 6. Aerosol chemical mass closure Acknowledgements This research was funded by the European Commission (contract no. EVK2-CT2001-00110), the Belgian Federal Office for Scientific, Technical and Cultural Affairs, and the Special Research Fund of Ghent University. As gravimetric PM, data from the PM10(NN) collections used Fine (PM2) size fraction For reconstituting PM2: 4 aerosol types considered • organic matter (OM), estimated as 1.6 * OC • elemental carbon (EC) • sulphate, derived from PIXE S • crustal matter, estimated as Al / 0.08 Percentage attribution of the gravimetric fine PM to the 4 aerosol types (components) for each of the samplings in Fig. 4 • organic matter is the dominant contributor to the fine PM Average % attributions of the fine PM to the aerosol types • OM 74 6 • EC 3.4 1.0 • sulphate 6.3 2.3 • crustal matter 1.9 1.2 On average 84 7 percent of the experimental fine PM explained by the sum of the 4 aerosol types Possible explanations for the missing mass • uncertainties in estimating some of the components, esp. organic matter (the multiplication factor of 1.6 for OC) • contribution from non-measured components (nitrate, ammonium, water) Coarse (PM10 - PM2) size fraction: preliminary results 2 aerosol types considered • sulphate, derived from PIXE S • crustal matter, estimated as Al / 0.08 Average % attributions of the coarse PM to the aerosol types • sulphate 2.7 0.9 • crustal matter 39 23 4. Time trends and median concentrations • Fig. 1 shows the time trends of the fine (PM2 or PM2.5) aerosol mass and of the percent PM2 of PM10, as derived from PM10(NT) • concentration of fine PM varies from up to 160 µg m–3 in September to a few µg m–3 in November • from 12 to 28 September and from 2 to 8 October several episodes with high fine PM levels, because of the large impact from biomass burning • Median concentrations (and concentration ranges) in the fine and coarse size fractions for PM, OC, EC, BC, and 16 elements are given in Table 1 References Birch, M.E., R.A. Cary, Aerosol Sci. Technol.25 : 221, 1996. Formenti, P., M.O. Andreae, L. Lange, G. Roberts, J. Cafmeyer, I. Rajta, W. Maenhaut, B.N. Holben, P. Artaxo, J. Lelieveld, J. Geophys. Res.106 : 14919, 2001. Maenhaut, W., I. Salma, J. Cafmeyer, H.J. Annegarn, M.O. Andreae, J. Geophys. Res.101 : 23631, 1996a. Maenhaut, W., R. Hillamo, T. Mäkelä, J.L. Jaffrezo, M.H. Bergin, C.I. Davidson, Nucl. Instr. and Meth.B109/110 : 482, 1996b. Maenhaut, W., J. Cafmeyer, X-Ray Spectrom.27 : 236,1998. Fig. 2