Download
1 / 60
650 likes | 1.12k Views
Conduct an experiment to investigate a situation using statistical methods Level 2 AS91265 3 credits. MCS: 14 Nov 2012. Honesty Box Experiment.

E N D
Conduct an experiment to investigate a situation using statistical methodsLevel 2 AS912653 credits MCS: 14 Nov 2012
Honesty Box Experiment An experiment was carried out in a staff common room at Newcastle University in England. There was an ‘honesty box’ system in place to pay for tea/coffee use. Each week, an A5 poster was put above the box. One week it has a picture of flowers, the other it has a picture of a pair of eyes.
Honesty Box Experiment There were about 48 staff who used the common room, and the honesty box system has been in use for years, so users had no idea that an experiment was taking place. Each week the research team recorded the total amount of money collected and the volume of milk consumed as this was considered to be the best index available of total drink consumption. The team then calculated the ratio of money collected to the volume of milk consumed in each week. On average, people paid 2.76 as much for their drinks on the weeks when the poster featured pictures of eyes.
Controlled experimentation on scurvy In 1747, while serving on the HMS Salisbury, surgeon James Lind carried out a controlled experiment to develop a cure for scurvy. Scurvy was a problem for sailors. During Anson's circumnavigation of the world in 1740, he lost 1400 men out of an original crew of 1900 - most of them allegedly from having contracted scurvy. Unknown at the time, scurvy is a disease resulting from a deficiency of vitamin C. Symptoms are malaise and lethargy, spots on the skin, bleeding gums and mucous membranes. A person with scurvy looks pale, feels depressed, and is partially immobilized. As it advances, there can be open, pus-forming wounds, loss of teeth, jaundice, fever and death. Lind selected 12 men from the ship, all suffering from scurvy. Lind limited his subjects to men who "were as similar as I could have them", that is he provided strict entry requirements to reduce extraneous variation. He divided them into six pairs, giving each pair different supplements to their basic diet for two weeks.
Controlled experimentation on scurvy The treatments were all remedies that had been proposed: • A quart of cider every day. • Twenty five drops of elixir vitriol (sulphuric acid) three times a day upon an empty stomach. • One half-pint of seawater every day. • A mixture of garlic, mustard, and horseradish in a golf-ball sized lump. • Two spoonful's of vinegar three times a day. • Two oranges and one lemon every day. The men who had been given citrus fruits recovered dramatically within a week. One of them returned to duty after 6 days and the other cared for the rest. The others experienced some improvement, but nothing was comparable to the citrus fruits, which were proved to be substantially superior to the other treatments.
Wall-Sit Experiment We are going to conduct an experiment to see: Does stretching before a wall-sit increase the length of time that it can be done for? For this experiment, we are going to divide the class into two groups – the control group and the treatment group. Control group: does exercise without any prior stretching. Treatment group: stretches before doing exercise. • How can we ensure that there is no bias in the allocation of groups? • Should we let people pick their own group? • How will we know if the treatment works?
Wall-Sit Experiment A “wall-sit” is done like this: stand with your back against a wall and lower yourself until your thighs are parallel to the floor. Lift your dominant foot about 5cm off the ground. The experiment ends when the subject puts their foot back on the ground. • How do we eliminate other sources of variation? • What kinds of variables could we measurein this experiment? The treatment group should take some time to stretch, especially their quads. Both groups should start the exercise at the same time.
Wall-Sit Experiment • How can we quantify the effect of the treatment? • How could we display the data? Normative data for the Wall Squat Test The following table is the USA norms for 16 to 19 year olds.
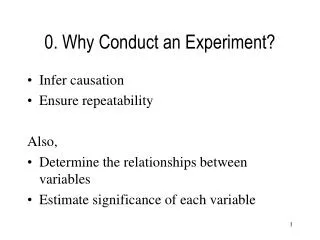
What is an Experiment? Experiment: A study in which a researcher attempts to understand the effect that a variable (the explanatory variable) may have on some phenomenon (the response) by controlling the conditions of the study. The researcher controls the conditions by allocating individuals to groups and allocating the value of the explanatory variable to be received by each group. A value of the explanatory variable is called a treatment. In a well-designed experiment, the allocation of subjects to groups is done using randomisation. Randomisation attempts to make the characteristics of each group very similar so that if each group was given the same treatment, the groups should respond in a similar way, on average. • Give an example for each word or phrase in red, using the wall-sit experiment that we did.
What is an Experiment? Pt 2 Experiments usually have a control group, a group that receives no treatment or receives an existing or established treatment. This allows any differences in the response, on average, between the control group and the treatment group(s) to be visible. When the groups are similar in all ways apart from the treatment received, then any observed differences in the response (if large enough) among the groups, on average, is said to be caused by the treatment. Example: in an experiment to test the effect of a fertilizer, the experiment can be controlled by assigning the treatments to randomly selected plots of land. This mitigates the effect of variations in soil composition on the growth of the plantsand allows us to see if the fertilizer works.
Geography Experiment • For this experiment, we need two groups, A and B. • You will be randomly allocated to a group. • You will need a pen/pencil to write an answer on the back of the piece of paper you get with your group on it. • When the experiment begins, everyone must remain silent. • Group A will look at the projector and answer the two questions on it as quickly as possible • Group B will have their eyes closed and head down on the desk. • When instructed, Group A will close their eyes and Group B will answer the questions on the projector.
Group A Do you think there are more than 15 countries in Africa? Write: “Yes” or “No” Now write down how many countries you think there are in Africa. ____________
Now, group A close their eyes and group B open their eyes. Remember: No talking!
Group B Do you think there are more than 50 countries in Africa? Write: “Yes” or “No” Now write down how many countries you think there are in Africa. ____________
“Geography” Experiment We will collect in the pieces of paper and reveal what question the other group got. • What do you think this experiment is testing? • What is the explanatory variable? • What is the response variable? • How will we compare the results? • What do you think the outcome will be? (“hypothesis”) • Why was it important that people were randomly allocated to groups? That is, how are we trying to reduce variation from variables other than the one that we are testing?
Independent Group Experiments The Honesty-Box, Scurvy, Wall-sit and Geography experiments are comparisons between independent groups. These comparisons can be treatment vs control (stretching vs not) or treatment 1 vs treatment 2 (seawater vs lemon juice). Analysis: • Comparative dot plots/box plots on the same scale. • Generate summary statistics (medians, means, IQR) • Compare what you see (differences, clusters, variation) Conclusion: • Descriptive, "the data suggests that using (the treatment) caused (the students to jump further) on average". • Can calculate the difference of averages (medians, means) for some quantification (how much further?). • NOT making an “inference about the population”.
Pencil-in-mouth Experiment • For this experiment, we need two groups, treatment and control. • You will be randomly allocated to a group. • The treatment group will conduct the experiment with a pen or pencil between their teeth. • You will need another pen to write on your recording sheet. • 10 slides will appear. • Rate each slide for its funniness on a scale from 1-10 where 1=not funny and 10=hilarious.
Slide 3 Slide 4
Slide 3 Slide 5
Slide 3 Slide 6
Slide 3 Slide 7
Slide 3 Slide 8
Slide 3 Slide 9
Slide 3 Slide 10
Pencil-in-mouth Experiment Total up the score from each slide and write at the bottom. • What do you think this experiment is testing? • What is the treatment? What is the response variable? • What do you think the outcome will be? (Hypothesis) • The scores will be written on the board. • Analyse the results by: • Constructing comparative dot plots/box plots on the same scale. • Generate summary statistics • Compare what you see • Write a conclusion: • “The data suggests that…”
Blind and Double-Blind Experiments In blind experiments, at least some information is withheld from participants in the experiments (but not the experimenter). For example, the subject might not know what the experiment is testing for. Or there might be a placebo given to the control group, and participants don’t know which group they are in. In double-blind experiments, both participants and experimenters have limited information while the experiment is being carried out. Double-blind experiments common in clinical trials of medical treatments, to verify that the supposed effects of the treatment are produced only by the treatment itself.
Placebos In double-blind experimentsusing placebos, The placebo is the "first" blind, and controls for the patient expectations that come with taking a pill, which can have an effect on patient outcomes. The "second" blind, of the experimenter, controls for the effects on patient expectations due to unintentional differences in the experimenter’s behaviour. Since the experimenter does not know which patients are in which group, they cannot unconsciously influence the patients. After the experiment is over, they then "unblind" themselves and analyse the results. Sometimes experiments reveal unexpected improvements in the placebo group as well as the treatment group. This is called “the placebo effect”.
Pepsi Challenge The challenge took the form of a blind taste test. At malls, shopping centres and other public locations, a Pepsi representative sets up a table with two blank cups: one containing Pepsi and one with Coca-Cola. Shoppers are encouraged to taste both and then select which drink they prefer. Then the representative reveals the two bottles so the taster can see whether they preferred Coke or Pepsi. The results of the test suggested that Pepsi was preferred by more Americans. When cola taste samples include labels of Coke or Pepsi the preference for Pepsi is reversed. Much of the difference in preference for Coke is accounted for by the label and not taste.
“New” Coke Some suggest that Pepsi's success over Coca-Cola in the "Pepsi Challenge" is a result of the flawed nature of the "sip test" method. Malcolm Gladwell’sresearch shows that tasters will generally prefer the sweeter of two beverages based on a single sip, even if they prefer a less sweet beverage over the course of an entire can. Just because a taster prefers a single sip of a sweeter beverage, doesn't mean he or she would prefer to have an entire case of it at home. Regardless, the taste test results had Coca-Cola worried, so in 1985 it reformulated the Coke recipe and replaced it with “New Coke”. The taste tests agreed it was better, but the public backlash was harsh. Within three months, “Coca-Cola Classic” was back on the shelves, and sales went higher than ever. New Coke was eventually branded Coke IIfrom 1990 until it disappeared from shelves in 2002.
Letter-Spotting Experiment • For this experiment, we use one group, who will perform two experiments with a treatment in the middle. • You will be issued with a piece of paper with the task on it. Do not turn it over until instructed. • You will need a pen to write on your recording sheet.
Letter-Spotting Experiment Read this paragraph ONCE. As you do so, count how many F’s you see. The necessity of training farm hands for first class farms in the proficient handling of farm livestock is foremost in the minds of effective farm owners. Since the forefathers of the farm owners trained the farm hands for first class farms in the proficient handling of farm livestock, the farm owners feel they should carry on with the former family tradition of training farmhands of first class farms in the effective handling of farm livestock, however futile, because of their belief that it forms the basis of effective farm management efforts. How many Fs did you count? __________ Turn your paper over when done
Letter-Spotting Experiment Sometimes an ‘F’ sounds like a ‘V’. Read this paragraph again ONCE. As you do so, count how many F’s you see. The necessity of training farm hands for first class farms in the proficient handling of farm livestock is foremost in the minds of effective farm owners. Since the forefathers of the farm owners trained the farm hands for first class farms in the proficient handling of farm livestock, the farm owners feel they should carry on with the former family tradition of training farmhands of first class farms in the effective handling of farm livestock, however futile, because of their belief that it forms the basis of effective farm management efforts. How many Fs did you count on your second attempt? __________ Turn your paper over when done
Paired Comparison Experiments Unlike earlier experiments, the Letter-spotting experiment is a comparison between paired data. These comparisons are before (baseline) vs after treatment or treatment 1 vs treatment 2. However, the data must be kept paired, as it is not independent.Analysis: • A link graph on the same scale. • Followed by a dot plot of differences. • Compare what you see (direction of arrows in link graph, clusters, variation, averages in dot plot of differences) Conclusion: • Descriptive, "the data suggests that (running for 5 minutes) caused (heart rates to increase) on average". • Can calculate the average of the differences (medians, means) for some quantification (how much did they increase by?)
Link Graphs • Represent the finding with alink graph on the same scale. • Make sure the data is kept as a pair,joined with an arrow. Compare what you see(direction/gradient of arrows in link graph): • The link graph shows that the vast majority of people improved on their second attempt. We see this as only one person scored fewer baskets on the second attempt (arrow pointing down) and only two people made no improvement (arrow pointing straight across). The remaining 8 people all improved (arrow pointing up). • This suggests to us that the treatment (advice on throwing a basketball) appears to improve the number of baskets obtained out of 20 attempts.
Dot Plot of Differences A dot plot of differences: • Compare what you see (clusters, variation, averages): • The differences are reasonably normally distributed, centred around 2, which is the median of the differences. The mean is 1.64, showing a slight skew to the left. • There are no significant clusters, but the mode is at a difference of 2 baskets. • The interquartile range shows the middle 50% of data is between 0 and 3 extra baskets. • This suggests to us that the treatment causes a typical improvement of 2 extra successful baskets.
Letter-Spotting Experiment Counting the total number of F’s before and after the treatment • What do you think this experiment is testing? • What is the treatment? What is the response variable? • What do you think the outcome will be? (Hypothesis) • The scores will be written on the board. • Analyse the results by: • Constructing a link graph. • Constructing a dot plot of differences. • Generate summary statistics • Compare what you see • Write a conclusion: • “The data suggests that…”
Alphabet Practice Experiment • For this experiment, we use one group, who will perform an experiment six times. • You will be issued with a piece of paper with the task on it. Do not turn it over until instructed. • You will need a pen to write on your recording sheet. • Each attempt needs to be timed, and the time recorded.
Alphabet Practice Experiment Time how long it takes to find the letters A to Z in order.
Alphabet Practice Experiment Recording times to find the letters of the alphabet in order • What do you think this experiment is testing? • What is the treatment? What is the response variable? • What do you think the outcome will be? (Hypothesis) • The times for the first and last attempt will be written on the board. • Analyse the results by: • Constructing a link graph. • Constructing a dot plot of differences. • Generate summary statistics • Compare what you see • Write a conclusion: • “The data suggests that…”
P roblem • Understand and define the situation that we are trying to investigate. • Identify what variables will be investigated. • Make sure you need an experiment to investigate the relationship between them. • What you would need to look for in the data? • Make a Hypothesis – predict the results of the experiment.