Download
1 / 41
410 likes | 533 Views
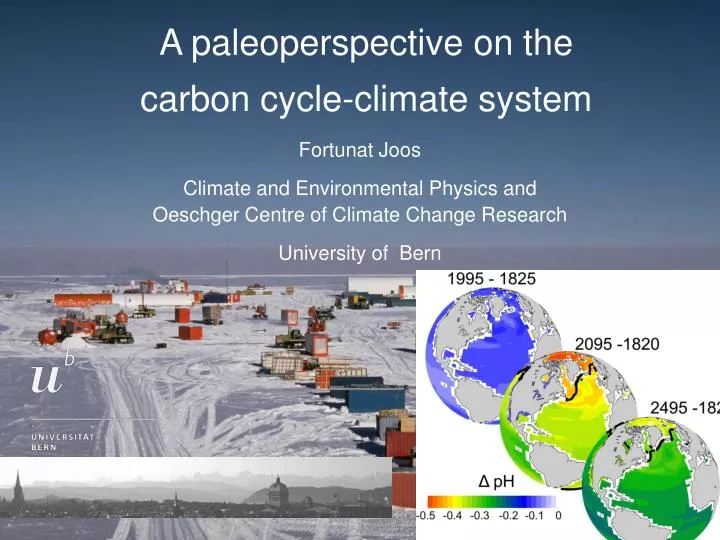
A paleoperspective on the carbon cycle-climate system. Fortunat Joos Climate and Environmental Physics and Oeschger Centre of Climate Change Research University of Bern. The 14 C inventory in the Earth System: a constraint on 14 C production. Production = - Decay of 14 C

E N D
A paleoperspective on the carbon cycle-climate system Fortunat Joos Climate and Environmental Physics and Oeschger Centre of Climate Change Research University of Bern
The 14C inventory in the Earth System: a constraint on 14C production
Production = - Decay of 14C • = l14NEarth • Decay rate: l=1/8267 yr • 14C Inventory, 14NEarth :mainly from data
Carbon Pools Atmosphere 590 GtC 820 GtC Fossil 5000 GtC Vegetation/Soil 3000 to 4000 GtC Marine Biota 3 GtC Ocean 38‘000 GtC Sediments
Dissolved Inorganic Carbon in the ocean varies between 1.9 and 2.5 mmol/kg mmol/kg Sarmiento and Gruber, Ocean Biogeochemical Dynamics, 2006
14C/12C in the Earth System Atmosphere D14C~ 0 %o Vegetation/Soil D14C~ -15 %o Ocean D14C ~ - 152.2 %o Reactive Sediments ( CaCO3, Organic)D14C~ -200 %o
permil Observed Deep Ocean D14C -50 14C/12C-ratio varies in ocean within 0.96 to 0.76 -150 -250 Simulated Deep Ocean D14C in the Bern3D model Müller, et al., J. Climate, 2005
An estimate: • Observation-based: [1026 atoms] • Ocean: 20,010 (85%) • Atmosphere: 360 (2%) • Model-supported: • CaCO3 Sediment 350 • Organic Carbon Sediment 170 • flux to litosphere · l 920 (6%) • vegetation 360 • soils ~1,500 (8%) • Total Inventory14NEarth 23,670 1026 atoms • (100%)
An estimate: • Total Inventory14NEarth 23,670 1026 atoms • Total Production: l14NEarth = 9.079 1018 atoms s-1 • = 1.78 atoms cm-2 s-1 • Next steps: • estimate transient effects • using the Bern3D model • (atmospheric variation • in 14C/12C: 6%) and • link to solar modulation • improve terrestrial estimate • (peat and permafrost)
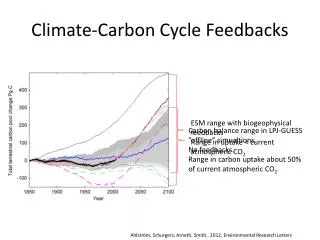
How do past changes in radiative forcing compare with ongoing forcing changes? Cause effect chain: Perturbation in radiative balance feedbacks Climate Change
Atmospheric CO2 and Antarctic temperature covaried over the past 800,000 years. CO2 acts as an amplifying feedback Rates of Change +4 Temperature anomaly (oC) -10 300 CO2 (ppm) 180 800 ka BP Today Age (Lüthi et al., 2008)
Variations in Earth‘s orbit control seasonal and latitudinal distribution of solar insolation and likely caused glacial-interglacial cycles Annual mean insolation Time scales: 20,000 ++ years Summer insolation 60 W/m2 10 W/m2 latitude -60 W/m2 -500 0 100 (IPCC, 2007 Time kyr
Changes in greenhous gas concentration and ice sheet growth acted as amplifying feedbacks Radiative Forcing at the Last Glacial Maximum Orbital: large distributional effects, but small change in global annual mean insolation (IPCC, 2007, Fig. 6.5)
Temperature response of the Bern model to orbital, greenhouse gas and ice sheet-albedo forcing Orbital only +16 Global Temperature (oC) Orbital + CO2 +ice +10 800 ka BP Today (Ritz et al., 2010)
Atmospheric CO2 is rising and far above the preindustrial range: CO2 from anthropogenic emissions causes warming and ocean acidification 350 Time scale of increase: decadal-to-century Perturbation life time: millennial 1 Radiative Forcing (W m-2) Carbon Dioxide (ppm) 300 0 250 5000 10000 0 Time (years before present) (IPCC, 2007, Fig. SPM-1a)
Rates of Change Rates of climate change co-determine severity of impacts on socio-economic and natural systems
Rates of change over the past 22,000 years inferred from splines through ice/atm. data The rate of increase in the combined radiative forcing from CO2, CH4 and N2O during the industrial era is very likely to have been unprecedented in more than 10,000 years (IPCC, SPM, 2007) Potential Smoothing of peak in ice (Joos and Spahni, PNAS, 2008)
How do rates of change in anthropogenic forcing compare with solar and volcanic forcing of the last millennium?
Rates of decadal-scale change: Natural (solar, volcanoes) versus human made volcanoes sum of current rates in anthropogenic forcings Trend in solar irradiance over satellite period: 10-6 W m-2 yr-1 Solar (MM 0.25%) (Joos and Spahni, PNAS, 2008)
Last millennium: Are suggestions of a small influence of solar changes on climate over the past millennium plausible? A carbon cycle-climate perspective
Today‘s solar activity is not unusual in the context of the last millennium: solar modulation from 14C tree ring record and carbon model 1600 AD Muscheler et al., 2005
Different solar forcing reconstructions from 10Be,14C, sunspot records differ in amplitude (not in evolution) Volcanic, solar and other forcings Wang et al., 2005 (MM -0.08%) Bard et al., 2000 (MM: -0.25%) 1000 2000 1500 Year (IPCC, 2007, Fig. 6.14)
Reconstructed ranges for low frequency variations in NH temperature are between ~ 0.3oC and 1oC Northern Hemisphere temperature reconstructions Temperature anomaly (oC) (IPCC, 2007, Fig. TS-20) 1600 2000 800 1200 Year
Preindustrial CO2 variations: an additional constraint (Etheridge al.) (Neftel al.) Siegenthaler et al., 2004
Climate models forced with prescribed forcing (low and high solar): simulated versus reconstructed NH temperature Anthropogenic Forcing With Temperature anomaly (oC) Without 1400 1600 AD 1800 1000 Year (IPCC, 2007, Fig. 6.14)
A significant fraction of the reconstructed NH interdecadal temperature variability over at least the seven centuries prior to 1950 is very likely attributable to volcanic eruptions and changes in solar irradiance Simulated temperatures with and without anthropogenic forcing and with weak or strong solar irradiance variations Anthropogenic Forcing Temperature anomaly (oC) 1400 1800 1000 Year (IPCC, 2007, Fig. 6.14)
Simulated versus ice core CO2 Simulated atmospheric CO2 versus ice core data Model results: smoothed with DML age distribution
Probabilistic estimates of the sensitivity of CO2 to temperature from reconstructions DCO2/DT (ppm/K)
A probabilistic assessment of the CO2-temperature sensitivity based on different temperature and CO2 reconstructions Probability 0 20 40 60 Sensitivity (ppm per oC) (Frank et al., 2010)
Comparison of data-based estimates of the sensitivity of CO2 to temperature with model results
Reconstructed 20th century C4MIP models Probability 0 20 40 Sensitivity (ppm per oC) (Range of median values) (Frank et al.,2010)
The amplitudes of the preindustrial decadal-scale Northern Hemisphere temperature changes from the proxy-based reconstructions (<1oC) are broadly consistent with the ice core CO2 record and our quantitative understanding of the carbon cycle and reconstructions of solar and volcanic forcing • The small changes in CO2, CH4, and N2O over the last millennium also suggest a limited range of climate variability over this period • A small solar influence on climate, despite large variations in solar modulation, is consistent with the climatic records of the last millennium
Thank you for your attention! Surface temperature anomaly after a collapse of the North Atlantic Circulation
The power spectrum of the 14C and 10Besolar modulation records shows common peaks Wanner et al., 2009
Low solar forcing: Simulated atmospheric CO2 versus ice core data Model results: smoothed with DML age distribution
High Solar Forcing Large low frequency temperature variations are not compatible with the ice core CO2 record
Natural forcings: contribution to 20th century warming is less than 0.15 K for all solar scalings