Download
1 / 19
190 likes | 370 Views
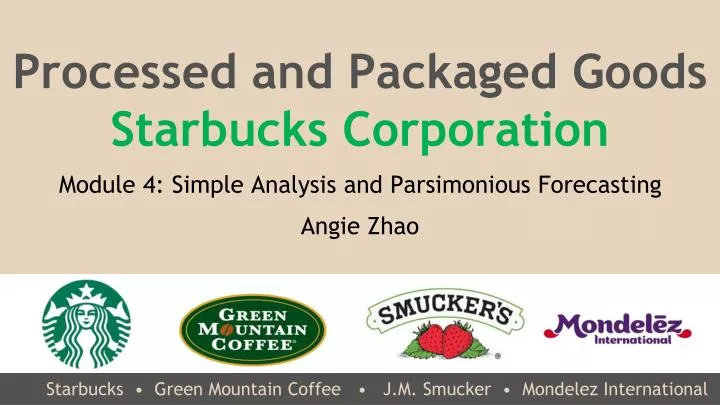
Processed and Packaged Goods Starbucks Corporation Module 4: Simple Analysis and Parsimonious Forecasting Angie Zhao. Starbucks • Green Mountain Coffee • J.M. Smucker • Mondelez International. STARBUCKS. Return on Enterprise Operations. All in millions except ratios.

E N D
Processed and Packaged Goods Starbucks Corporation Module 4: Simple Analysis and Parsimonious Forecasting Angie Zhao Starbucks •Green Mountain Coffee •J.M. Smucker • Mondelez International
Return on Enterprise Operations All in millions except ratios
Return on Enterprise Operations • RNEA of Starbucks was significantly above that of competitors • Reasons to be discussed ` `
Breaking Apart RNEA - Time Series • Fluctuations in RNEA arelargely caused by fluctuations in EPAT resulting from many one-time items • E.g. 2013: • Litigation charges of $2.9b • Income tax benefit of $1.07b arising from the litigation
Breaking Apart RNEA - Time Series • Fluctuations in RNEA arelargely caused by fluctuations in EPAT resulting from many one-time items • E.g. 2013: • Litigation charges of $2.9b associated with Kraft arbitration • Income tax benefit of $1.07b arising from litigation charges • EATO – stable and increasing
Breaking Apart RNEA – Cross Sectional • EPM is the lowest in the group • Many one-time items are included in calculations
Breaking Apart RNEA – Cross Sectional • EPM is the lowest in the group • Many one-time items are included in calculations • EATO of Starbucks is significantly above competitors • larger sales (2x to 3x), while 9% revenue came from licensed stores
Sales Growth Assumption Sales growth – 2014 Q1 conference call 5% - U.S. company-operated comparable stores 15% - U.S. licensed stores 8% - the Americas, 11% - EMEA, 25% - CAP 7% - Channel Development • Company-operated stores • Licensed stores • CPG, foodservice & other • Overall sales growth forecast?
Sales Growth Assumption • Sales growth of competitors also fluctuated a lot • No reason to sway from the average of Starbucks’ sales growth • Assume a 12% sales growth
EPAT from Sales • Excluded one-time items • Litigation Charges, related tax benefit, and OCI items • Less volatile EPAT and EPM (compare)
EPM Assumption Assume EPM to be the average: 10.12%
EATO Assumption EATO quite stable Assume a 5.7 EATO
Industry Analysis, Concerns & Issues • GMCR, MDLZ, SJM may not be sufficient to gather information on SBUX • Coffee is not the primary product of MDLZ and SJM • This leaves GMCRcomparable to SBUX in terms of business and products, but not size (1/4x sales of SBUX) • Peer companies • Capture only the coffee production segment (“CPG, Foodservice, and other”) of SBUX • Omit store sales (both company-operated and licensed) • Macro effects on industry • Rising coffee bean prices • Political factors