Download
1 / 2
20 likes | 28 Views
Intellicus introduces real-time data visualization tool enabling you to analyze your data as it comes, without any time lag. It's highly scalable and robust architecture helps you visualize and get alerts right in time.<br>Intellicus is one of the worldu2019s leading Business Intelligence, and Analytics platform. There are more than 60% of Fortune 500 companies which are using the Intellicus to build powerful reports and dashboards with ease. <br>

E N D
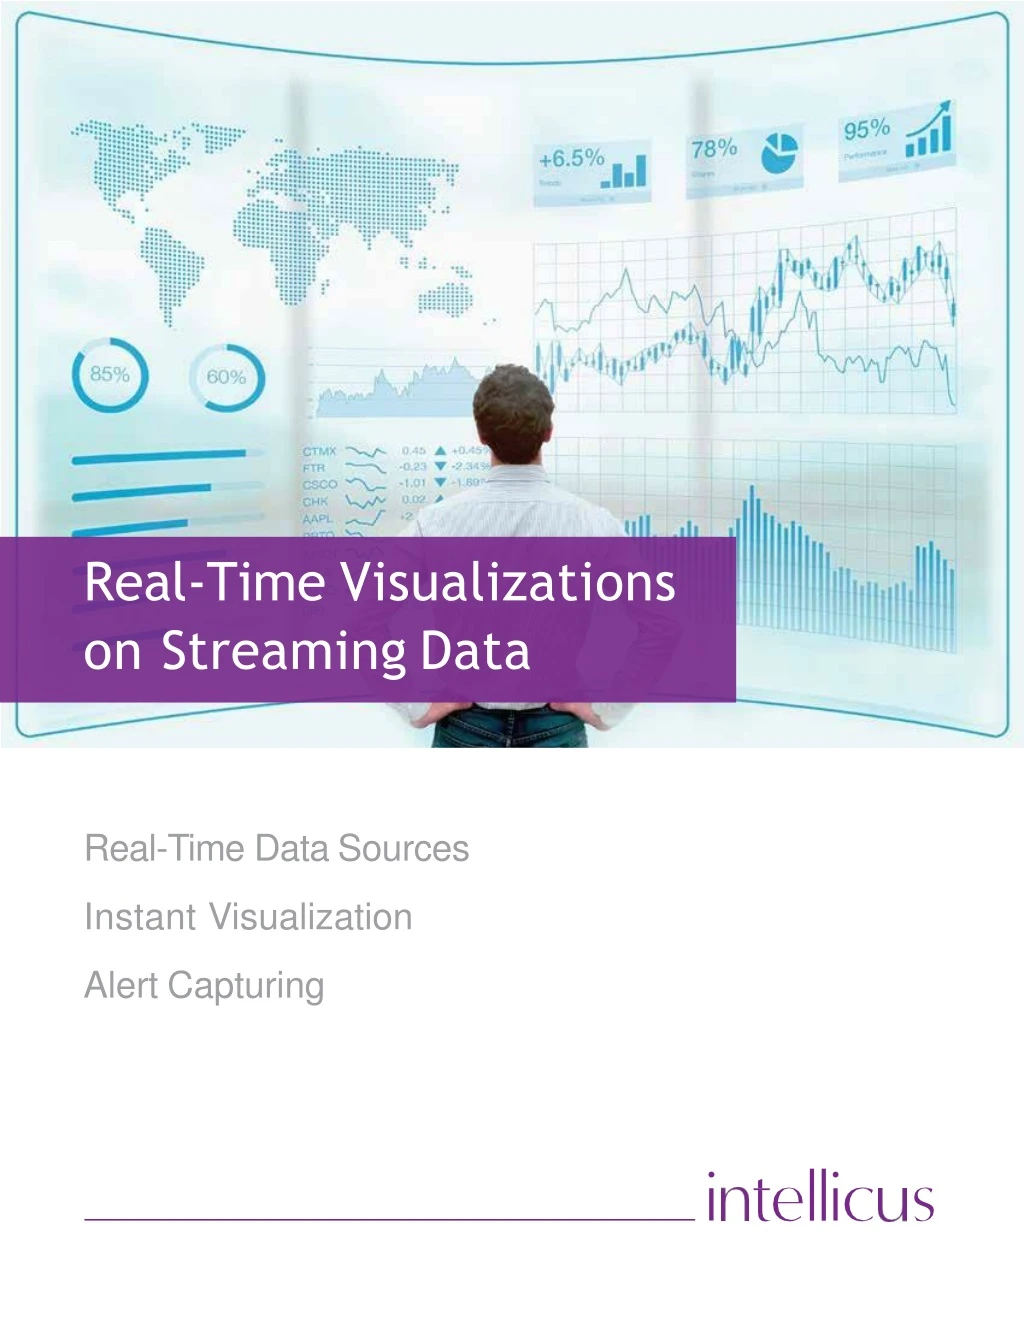
Real-Time Visualizations on Streaming Data Real-Time Data Sources Instant Visualization Alert Capturing
Intellicus introduces real-time visualizations on streaming data enabling you to analyze your data as it comes, without any time lag. Our highly scalable and robust architecture helps you visualizeand get alerts right in time. The IoT Intellicus supports dynamically changing counter charts, gauge charts, GIS Maps and various XYcharts among others. With the advent of IoT and data coming from different devices, businesses and consumersare generating data at a recordpace every day. Nowadays, it’s not only about making well-informed decisions, but they should be timely and actionable too. Real-Time Visualizations: • Multiple widgets -View different indicators ofyour business in real-time on a singlescreen Intellicus lets you constantly track your business processes from the data coming from multiple sources. You can extract valuable insights fromyour moving data to make near real-time decisions and increase your organization’s operational efficiency. • Browser-based viewing -Access and analyzeyour real-time data from anywhere with the option of accessing reports via a webbrowser • Pause & play -Pause & play at your pointof interest and analyze itclosely Data on thequeue •Filter - Create filter criteria to easily view specific information that you are lookingfor With Intellicus’ real-time data visualization tool you can read over 5000 events per second, and hundreds of users can view the data simultaneously. Intellicus can connect to applications such as StreamAnalytix™ and others, which emit data continuously on Message Queuing softwares like Rabbit MQ, Kafka, Java Message Queue etc. to provide visualizations on streamingdata. • Snapshots -Take snapshots manually or automatically, if the real-time indicatorscross given thresholds © IntellicusTechnologies. info@intellicus.com | www.intellicus.com