Download
1 / 5
50 likes | 63 Views
In this article, we present a novel approach for effective segmentation of color images, by integrating the advantages of the YIQ and the Log Normal Distribution features. Log Normal Distribution is considered in this paper, for effective segmentation, by considering the pattern of the pixels. The proposed method entails less complexity and is thus can be used reasonably very well for realistic image segmentation purposes.

E N D
Original Article Color Image Segmentation Based on Log Normal Distribution Ch. Murali Krishna*1 and Y. Srinivas2 1Department of CS, Government Polytechnic College for Women Bheemili, Visakhapatnam, India 2Department of Info. Tech, Gitam University, Visakhapatnam, India *Corresponding Email: cmk2008@rediffmail.com ABSTRACT In this article, we present a novel approach for effective segmentation of color images, by integrating the advantages of the YIQ and the Log Normal Distribution features. Log Normal Distribution is considered in this paper, for effective segmentation, by considering the pattern of the pixels. The proposed method entails less complexity and is thus can be used reasonably very well for realistic image segmentation purposes. The relationship between Hue and Saturation plays a leading role while segmenting the color images which can be observed through the experimental results. The performance evaluation of the developed model is carried out by using metrics like Peak Signal to Noise Ratio (PSNR), Mean Squared Error (MSE), Image Fidelity (IF). Keywords: Segmentation, Color models, Performance evaluation, Log normal distribution, PSNR and MSE. INTRODUCTION Image segmentation is the core consideration involved in image analysis. It is a process of dividing the actual image into various components heterogeneous information transformed into a homogeneous group. In segmentation features play a vital role. These features help to identify the structural characteristics, surfaces and other core information about the images. In processing, the images are generally visualized either in grey scale or color format. Pixel intensity categorizes the grey scale image, where as in color images, the color is a response of the human eye, while perceiving a object having different wavelengths in electromagnetic spectrum. Lot of information is driven in the areas of image classification using both generative and degenerative approaches1. Among these models, generative models are proved to be much effective compared to non-parametric or degenerative models2, as they consider the pattern of the pixels at a given point of time. Among these models, most of the works presented using Gaussian Mixture Model (GMM) in particular, are highlighted in the literature. This usage is mainly due to such that can the be segmentation and American Journal of Computer Science and Information Technology www.pubicon.info
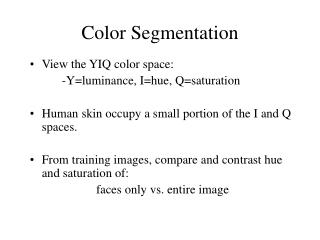
Krishna et al_________________________________________________ ISSN 2349-3917 the assumption that every image considered in the universe exhibit s a random phenomenon and generates a distribution which exhibits a symmetric pattern or exhibits a normal distribution pattern. However, most of the realistic images does not fit into this bell shaped curve or symmetric nature3,4 as the range of the images may not be infinite or the pattern of the pixels may be asymmetric5. Hence assumption of GMM for the segmentation of the images is a rudimentary approximation. Other arguments about the GMM are that the accuracy of the GMM along the object boundary is poor6 and the same weight cannot be assigned to every pixel belonging to a particular class. Hence it is needed to consider effective models for efficient segmentation. Also in case of color images the features play a vital role and every pixel inside the image region are highly influenced by the descriptions namely texture, color and intensity. Intensity and texture features can be combined into the color features and hence color feature are assumed to be a most predominant feature in the color images7-9. Among the various color spaces YIQ color spaces are considered to be the best than RGB, with respect to human perception10. Hence in this paper, we propose a model based on Log Normal Distribution using YIQ features. The feature vectors derived from each of the image regions follow a pattern and this pattern is asymmetric and considered to be following a log normal distribution. The experimentation is carried on using Bench mark data sets namely BERKLY and natural assessment of the proposed method is done by considering metrics like Peak Signal to Noise Ratio (PSNR), Mean Squared Error (MSE), and Image Fidelity (IF). The remaining presentation of the paper is as follows: Part 2 of the paper deal with Log Normal Distribution, in Part 3 we highlight the YIQ model and its conversion, Part 4 of the paper emphasizes about the data base considered. In section 5 the clustering of the data using k [means] algorithm is presented. Section 6 of the paper highlights the performance evaluation experimentation and the concluding section 6 summarizes the paper. Log normal distribution Most of the images in nature are asymmetric, in particular in color images, the perceived object wavelength spectrum may not be symmetric .Hence it is needed to consider asymmetric effective analysis of images. Many models have been highlighted in the literature for catering the asymmetric distributions. Among these distributions skew, Log normal, Gamma are mostly highlighted in the literature. Among the various asymmetric models Log normal distribution is considered experimentation in this paper. The main advantage of considering log normal distribution is that it caters the images which are both symmetric and non symmetric in nature .The PDF of the Log normal distribution is given by e x Color models based on YIQ The YIQ components, luminance(Y), hue (I) and saturation (Q).The gray scale information of the given image in the RGB color space can be extracted using the luminants. The color information can be extracted using the other two components. The conversion of RGB to YIQ is given by, [y]=[0.299 0.587 0.114] [R] (2) [I]=[0.596 -0.275 -0.321] [G] (3) [Q]=[0.212 -0.523 0.311] [B] (4) and the distributions for nature of for the 2 (ln( x ) ) 1 2 2 , x 0 f (x ) 2 (1) model has three images. The AJCSIT[3][1][2015] 074-078
Krishna et al_________________________________________________ ISSN 2349-3917 Data set Experimentation and performance evaluation In order to experiment the data, the data set is generated from the images as defined in section 4 of the model. Each image is normalized to a fixed size of 100*100. To exhibit the developed model, the images considered from the database of Berkeley are considered. The feature vectors of the entire image are considered as input for the segmentation process. The feature vector of the image under consideration is understood to follow a mixture of log normal distribution. That is, the image contains K regions and the feature vector of the each image region follow a log normal distribution with different parameters. The number of segments in each of the eight images considered for experimentation is determined by the histogram of pixel intensities the images are clustered into groups. These clusters serve as the initial parameters for effective segmentation. The initial parameters ‘µ’ and ‘σ’ are estimated by the K means algorithm. The human perception of image can be characterized through a univariate random variable consisting of Hue which can be calculated using basic structure of a color appearance model6. converted into gray scale using the luminance. Basing on the likely hood estimate of the pixel we identify the region to which it belongs by maximizing the likely hood estimate using Distribution given in section 2 of the paper. Basing on the likely hood estimation of the image the pixels are reassigned. The evaluation is carried out by considering 8 images. The output is measured using performance evaluation, metrics such as mean squared error, PSNR and IF. The results obtained are presented in table 1. In order to evaluate the performance of the given model we have considered two data sets namely symmetric data set of natural images and Bench mark data set of BERKLEY (http://www.eecs.berkeley.edu/ Research/Projects/CS/vision/dataset/images. html). Each image is preprocessed to remove noise and normalized into a size of 100*100.These images are stored in a local data base. K means clustering algorithm In order to effectively segment the data relevant information is to be extracted. For this purpose clustering algorithms are considered. Amongst the set of algorithms available for clustering, K means algorithm is demonstrated to be effectual10. On the other hand, the main drawback in the usage of K means algorithm lies in its initial estimation. Authors11-13 histogram based approaches are more effective for the identification of initial value of K. Hence in this paper we consider the histogram of the images and considering the peaks, Number of initial clusters k is decided. K means algorithm 1.Identify the initial clusters K by plotting the histogram. 2.Compute the distance between each of the pixels to the cluster center using Euclidean distance. 3.Calculate new cluster centre so that squared error distance of each cluster should be minimum. 4.Repeat the step2 and step 3 until no more pixels are swapped. 5.Terminate the procedure. proposed that The images are Log Normal AJCSIT[3][1][2015] 074-078
Krishna et al_________________________________________________ ISSN 2349-3917 6. Rahman Farnoosh, Gholamhossein Yari, Behnam Zarpak,2008, " Image Segmentation using Gaussian Mixture Models", IUST International Journal Science, Vol. 19, No.1-2, 2008, pp.29-32. Srinivas. Y and Srinivas. K. 2007, “Unsupervised image segmentation using finite doubly truncated gaussian mixture model and Hierarchical clustering”, Journal of Current Science, Vol.93, No.4, pp.507- 514. Srinivas Y., Srinivasa Rao K. and Prasad Reddy P.V.G.D. 2010, ”Unsupervised Image segmentation Based on Finite Generalized Gaussian Mixture Model With Hierarchical Clustering, International Computational vision and Biomechanics, Vol.3, No.1, pp.73-80. Sujaritha M. and Annadurai S. 2010, Color image segmentation using Adaptive Spatial Gaussian Mixture Model”, International journal of signal processing 6:1, pp. 28-32. 10.K.S. Fu and J.K Mui, 1981, A survey on image segmentation", Pattern Recognition, Vol.13, pp3-16. 11.Gau, W. L., Buehrer, D. J., Vague sets,1993, IEEE Transactions on Systems, Man and Cybernetics, Vol.23, No.2, pp.610-14. 12.Ohta, Y., Kanade, T., Sakai, T. 1980, Colour information for Computer Graphics and Image Processing, Vol.13, pp. 222-41. 13.Eskicioglu A.M. and Fisher P.S. 1995, “Image Quality Performance”, IEEE comm.., Vol.43, No.12, pp.2959-2965. 14.T. Rajesh et al, 2013, Performance Analysis of Iris Recognition System -A Review, American Journal of Computer Science & Information Technology, vol1 (1), pp 39-50 15.Joshi et al, 2013, “Over view of Edge Detection Techniques”, American Journal of Computer Science Technology, vol1 (1), pp 20-32. CONCLUSION In this paper a novel approach of image segmentation based on Log Normal Distribution and YIQ features is presented. This model is very much useful in NTPC, camera systems. The research in this direction will help out to have deeper insight into the various segmentation issues based on different color models. The evaluated results are presented in table 1 and shows that the developed model contributes a significant importance towards the segmentation of images. REFERENCES of Engineering 7. 8. journal for 1. Bengt Muthen .1990 “Moments of the censored and truncated bivariatenormal distribution”, British Mathematical and Statistical psychology, No.43, pp.131-143. Dipti Patra, Mridula J. and Kumar K.. 2011"Combining GLCM Features and Markov Random Field Model for Colour Textured Image Segmentation", Int. Conf. on Devices and Communications (ICDeCom), pp.1-5. N. R. Pal, S. K. Pal,1993"A Review on Image Segmentation Techniques", Pattern Recognition, Vol. 26, No. 9, pp. 1277- 1294. Farag A.A., El-Baz A. and Gimelfarb G. 2004,"Precise Image Iterative EM-Based Empirical Grey Level Distributions with Linear Combinations Proceedings of the 2004 IEEE Computer Society Conference on Computer Vision and Pattern Recognition (CVPRW’04). Ferri F. and Vidal E. 1992, "Color image segmentation and labeling through multi edit condensing ", pattern Recognition Letters, Vol.13, No.8, pp.561-568. 9. Journal of 2. 3. region segmentation, 4. Segmentation Approximation by of Measures Transactions and their On of Gaussians", Workshops 5. & Information AJCSIT[3][1][2015] 074-078
Krishna et al_________________________________________________ ISSN 2349-3917 Table 1. Performance evaluation Input Output MSE PSNR IF 0.34 34.2 0.89 0.56 29.74 0.7 0.89 30.23 0.67 0.67 31.2 0.54 0.81 23.7 0.65 0.45 42.4 0.55 0.77 39.6 0.6 0.34 45.3 0.69 AJCSIT[3][1][2015] 074-078