Download
1 / 36
360 likes | 500 Views
Populations are the units of evolution. Figure 13.6. Why do organisms change?. What is evolving? gene pool, microevolution Five agents of evolution 3. Types of natural selection.

E N D
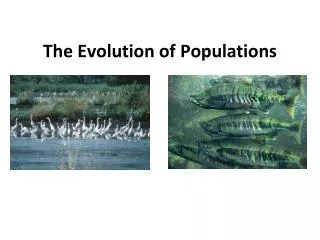
Populations are the units of evolution Figure 13.6
Why do organisms change? What is evolving? gene pool, microevolution Five agents of evolution 3. Types of natural selection
Evolution happens when populations of organisms with inherited variations are exposed to environmental factors that favor the reproductive success of some individuals over others Figure 1.6C
Populations are the units of evolution • A population is a group of interbreeding individuals • A species is a group of populations whose individuals can interbreed and produce fertile offspring Figure 13.6
What is evolving? • gene pool = total collection of genes in a population at any one time • Microevolution is a change in the relative frequencies of alleles in a gene pool
Five agents of microevolution 1. Mutation changes alleles 2. Genetic drift = random changes in allele frequency Bottleneck Founder effect
Genetic drift - effects of population size: LARGE POPULATION = 10,000 SMALL POPULATION = 10 1,000 10,000 1 10 allele frequency = = 10% allele frequency = = 10% 50% of population survives, including 450 allele carriers 50% of population survives, with no allele carrier among them 0 5 450 5,000 allele frequency = = 0% allele frequency = = 9% little change in allele frequency (no alleles lost) dramatic change in allele frequency (potential to lose one allele)
Bottleneck effect Founder effect Population size is critical in preserving species. Figure 13.11B, C
Gene flow can change a gene pool due to the movement of genes into or out of a population ex. Migration • Nonrandom mating within a population 5. Natural selection leads to differential reproductive success
Male and female lions Figure 13.20x
Natural selection - results in the accumulation of traits that adapt a population to its environment - the only agent of evolution that results in adaptation.
What are sources of genetic variation? • Mutation can create new alleles, new genes. • Sex - Recombination of genes in sexual reproduction
Why doesn’t natural selection eliminate all genetic variation in populations? • Natural selection tends to reduce variability in populations. Mechanisms which counteract: • The diploid condition preserves variation by “hiding” recessive alleles (Bb) • Balanced polymorphism (2+ phenotypes stable in population) may result from: 1. heterozygote advantage Aa > aa and AA 2. frequency-dependent selection 3. variation of environment for a population
Many populations exhibit polymorphism and geographic variation Figure 13.13
Not all genetic variation may be subject to natural selection • Neutral; no apparent advantage or disadvantage • Example: human fingerprints Figure 13.16
Endangered species often have reduced variation • Low genetic variability may reduce their capacity to survive as humans continue to alter the environment • cheetah populations Figure 13.17
What is an organism’s evolutionary fitness? • the contribution it makes to the gene pool of the next generation relative to the contribution made by other individuals • Production of fertile offspring is the only score that counts in natural selection
There are three general outcomes of natural selection Originalpopulation Frequency ofindividuals Phenotypes (fur color) Originalpopulation Evolvedpopulation Stabilizing selection Directional selection Diversifying selection Figure 13.19
80 beak depth 1976 60 40 Number of individuals Average beak depth, 1976 20 Average beak depth, 1978 1978 0 5 6 7 8 9 10 11 12 13 14 Beak depth (mm) Shift of average beak depth during drought
The excessive use of antibiotics is leading to the evolution of antibiotic-resistant bacteria • Example: Mycobacterium tuberculosis Figure 13.22
Natural selection cannot fashion perfect organisms • This is due to: • historical constraints • adaptive compromises • chance events • availability of variations
What is a species? • appearance alone does not always define a species • Example: eastern and western meadowlarks Figure 14.1A
What is a species? • Naturally interbreeding populations - potentially interbreeding - reproductively isolated from other species What about asexually reproducing organisms? Extinct species? Shy species?
MECHANISMS OF SPECIATION When does speciation occur? • When geographically isolated, species evolution may occur • gene pool then changes to cause reproductive isolation = allopatric speciation Figure 14.3
A ring species may illustrate the process of speciation 1 OREGON POPULATION SierraNevada 2 Yellow-blotched Yellow-eyed INLANDPOPULATIONS COASTALPOPULATIONS Gap in ring Large-blotched Monterey 3 Figure 14.1C
Reproductive barriers between species • Habitat - different locations • Timing - mating, flowering • Behavioral - mating rituals, no attraction • Mechanical - structural differences • Gametic - fail to unite • Hybrid weak or infertile
Courtship ritual in blue-footed boobies is an example of behavioral isolation • Many plant species have flower structures that are adapted to specific pollinators • mechanical isolation Figure 14.2A, B
A horse and a donkey may produce a hybrid offspring, a mule • Mules are sterile • Hybrid sterility is one type of postzygotic barrier Figure 14.2C
Sympatric speciation • No geographical isolation • Mutation creates reproductive isolation • Polyploidization • Hybridization
When does speciation occur? Cactusground finch Smalltree finch Mediumtree finch Woodpeckerfinch Mediumground finch Smallground finch Large cactusground finch Vegetarianfinch Largetree finch Mangrovefinch Greenwarbler finch Graywarbler finch Largeground finch Sharp-beakedground finch Budeaters Seedeaters Cactus flowereaters Insecteaters Ground finches Tree finches Warbler finches Common ancestor fromSouth America mainland
When does speciation occur? • Specialists - Galapagos finches • Generalists - horseshoe crabs, cockroaches • New environments - ecological niche
Adaptive radiation on an island chain - specialization for different niches 1 Species Afrom mainland 2 B A B 3 B B 4 C C C C D C D 5 Figure 14.4B
Continental drift has played a major role in macroevolution • Continental drift is the slow, steady movement of Earth’s crustal plates on the hot mantle EurasianPlate NorthAmericanPlate AfricanPlate PacificPlate Splitdeveloping NazcaPlate SouthAmericanPlate Indo-AustralianPlate Antarctic Plate Edge of one plate being pushed over edge of neighboring plate (zones of violent geologic events) Figure 15.3A
CENOZOIC Eurasia North America Africa • influenced the distribution of organisms India • Continental mergers triggered extinctions • Separation of continents caused the isolation and diversification of organisms SouthAmerica Australia Antarctica Laurasia Millions of years ago MESOZOIC Gondwana Pangaea PALEOZOIC Figure 15.3B
Speciation - how much change is needed? • Gradual vs. jerky • Evidence: • Fossil record • Genetic differences between species • Homeotic genes
Single mutation can result in major differences in body structure Fly chromosomes Mouse chromosomes • homeotic genes control body development Fruit fly embryo (10 hours) Mouse embryo (12 days) Adult fruit fly Adult mouse Figure 11.14