Download
1 / 19
190 likes | 262 Views
Annual Revenue Survey February 12, 2013. In preparation for the 2014 City Budget. City Budget Revenues. 2013 City Budget of $121,804,142.

E N D
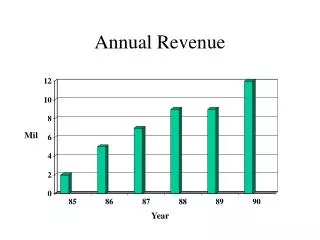
Annual Revenue SurveyFebruary 12, 2013 In preparation for the 2014 City Budget
City Budget Revenues 2013 City Budget of $121,804,142 Reminder: Pages 53 and 54 of the published 2013 City Budget discuss growth rates and assumptions of major revenue sources. This information is also available online.
Beginning Cash Balances All budgeted funds In 2013, this increase primarily comes from two funds: $1,908,790 ~ EcoDevo Fund $1,673,871 ~ Bond & Interest fund
Major Revenue Sources Property Taxes Property Taxes – From 2012 to 2013, the total increase in property taxes was $918,727. Of this amount, City Services had no increase and only $76,431 increase was attributed to the Bond & Interest Fund. RCPD and Library Bond & Interest City Services
Major Revenue Sources Sales Taxes Sales Taxes – In 2012, The City’s 1₵ sales tax increased 5.7% over 2011, including an increase of about 5.8% over what was budgeted for 2012. Amount Budgeted
General Fund Revenues 2013 General Fund Budget of $25,993,571
Total Debt Forecast 1,908,335 53,993,410 3,399,505 34,845,146 71,645,000 50,800,000 41,861,977 66,567,676 84,399,537 74,772,324 11,427,214
Commissioner Feedback • Revenue Projections • Expenditures • Commissioner Priorities for 2013 First Budget Work Session May 14th