Download
1 / 34
340 likes | 348 Views
This study focuses on detecting small changes in large soil carbon pools and dynamics by using stable isotopes and SOM fractionation. It examines the effects of land use change, elevated CO2 levels, and plant proximity on soil carbon content. The research is conducted in two locations: the CARBOEUROPE meeting in Finland in 2005 and the EUROFACE project in Tuscania, Italy. The findings provide valuable insights into soil carbon sequestration and dynamics.

E N D
3rd CARBOEUROPE Meeting, Finland 2005 Detecting changes in soil C pools and dynamics by means of stable isotopes and SOM fractionation M.Francesca Cotrufo Dip. Scienze Ambientali Seconda Università di Napoli
Motivation: “Looking for small changes in large pools and fluxes”
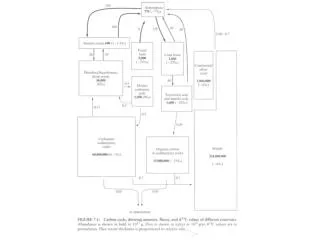
Litter and soil C fluxes Litter fall Soil respiration Root respiration & decomposition Wood & Litter decomposition Fresh soil carbon input turnover Organic Matter turnover Stabilized soil organic carbon
CARBOEUROPE/COST Action 627 Joint workshop “Partitioning soil CO2 efflux” Villa Orlandi, Capri, Italy Oct 2nd - 4th 2004
Heterotrophic contribution to soil respiration • Results of a meta-analytical review RH/RS = -0.149 ln(RS) +1.569 Subke, Inglima & Cotrufo, GCBAnnual Review, 2006
The SOM aggregation concept Microaggregates ~ 50-250 m Plant and fungal debris Fungal or microbial metabolites Particulate organic matter colonized by saprophytic fungi Biochemically recalcitrant organic matter Silt-sized aggregates with microbially derived organomineral associations Clay microstructures Decomposing roots and detritus become encrusted with mineral particles forming microaggregates Decomposition continues at a slow rate in stable aggregates, due to formation of organomineral associations Eventually, organic binding agents decompose sufficiently for aggregate to be destabilized, accelerating decomposition until new aggregate is formed
8 mm sieved soil Wet sieving >250mmfraction <53mmfraction Micro-aggregate isolator 53-250mmfraction(m) Silt + clay Coarse POM Density flotation Light fraction (< 1.85 g cm-3) Intra-microaggregate POM (iPOM) Micro’s (mM) Density flotation Intra-microaggregate POM (iPOM) Light fraction (< 1.85 g cm-3) Fractionation by size and density scheme
Short-term effects on SOM dynamics after change in land use and exposure to increased [CO2] The EUROFACE project • HYPOTHESES: • Afforestation increases aggregate stability and soil C sequestration • Elevated [CO2]increases aggregation and SOC pools through higher C input
EUROFACE Location: Tuscania, Central Italy (42° 22’ N 11° 48’ E 150 m asl) . Climate: Annual rainfall 676 mm, annual mean temperature 15 °C. Project PopFACE (EKV 4-CT96_0657)/ EUROFACE: from 1999 – Establisment of a poplar plantation (P.x euroamericana) on an agricultural region. 6 exsperimental plots, whitin the plantation, each with three poplar species (Populus alba, (cloneA), P. nigra, (clone B), e P.x euroamericana, (clone C)); 3 plots are exposed to ambient and 3 to elevated (+200 ppm) concentration of CO2with a FACE (Free Air Carbon dioxide Enrichment) operating system
Experimental design & methods • 4 Vegetation types: Agricultural field (T. aestivum) (A); Poplar plantation (P); clones B (P. nigra) and C (P. x euroamericana) for the FACE system. • 6 Replicated samplings along two 50m transects, for A and P @ 0-10 cm depth. • 10 Soil cores per sampling plot – Pooled. • 4 soil cores, pooled, for clones B and C for each ring of the FACE. • Fractionation for size and density. • Analyses of C content for the total and for all the fractions isolated.
Carbon changes in SOM fractions: 1. LAND USE CHANGE EEFFECT CP = C content of soil fractions under poplar plantation CA = C content of respective fractions in the agriculture soils Del Galdo et al. GCB, submitted
2. ELEVATED [CO2] EFFECT CF = C content in FACE soil fractions CC = C content of controls Del Galdo et al. GCB, submitted
Sky Oaks CO2-enrichment field station Past present and future atmospheric [CO2] effects on SOM dynamics • HYPOTHESIS: • From pre-industrial level to 750 ppm, the increase in atmospheric [CO2]increases aggregation and SOC pools due to higher plant C input, thus the soil “close” to plants is the most affected.
Sky Oaks CO2-enrichment field station Sky Oaks CO2-enrichment field station (Warner Springs, CA, USA) • 12 closed chambers within an Adenostoma fasciculatum-dominatedchaparral ecosystem, fumigated for 6 years with labelled CO2 ranging from 250 to 750 ppm in 100 ppm step increments, with a total of two replicate chambers for each of the six treatments. • Three non-fumigated open chambers were selected as control (ambient).
Experimental design & methods • Soil sampling (0-10 cm) • 2 soil cores sampled close to the A. fasciculatum (pooled); • 2 soil cores collected far from the plant. • Soil fractionation for size and density; • Analyses of C and d13C for the totals and for all the fractions isolated
4000 3000 ) SC -2 2000 m C (g m M 1000 0 control 250 350 450 550 650 750 CO (ppm) 2 Close to plant 4000 3500 3000 ) SC 2500 -2 m 2000 C (g m 1500 M 1000 500 0 control 250 350 450 550 650 750 CO (ppm) 2 Far from plant SOM C distribution: Del Galdo et al. SBB, submitted
Effects of land use change on soil C 100 years 20 years
250 250 0-10 cm 10-30 cm New C 200 200 Old C 150 150 100 100 50 50 0 0 C A G C A G C A G C A G C A G C A G C A G C A G C A G C A G C A G C A G C A G C A G M M coarse coarse POM POM mM mM iPOM_mM iPOM_mM silt&clayM Silt&clayM m m iPOM_m iPOM_m Partitioning of soil C into:“new” - C derived from vegetation “old” – native SOC g C kg-1 sandfree aggregate C= Crop A=Afforested G=Grassland Del Galdo et al., GCB, 2003
C nuovo C nativo 0-10 cm10-30 cm 1000 500 C g m-2 0 -500 -1000 M m silt&clay M m silt&clay -1500 Identify SOC dynamics Del Galdo et al., GCB, 2003
“Modelling the measurable” “Measuring the modellable” Del Galdo et al., GCB, 2003
Soil & P. taeda Soil & C. canadensis Soil & L. styraciflua Litter respiration measurements in lab-experiment Rubino et al., in progress
Soil & P. taeda Soil & C. canadensis Soil & L. styraciflua Dynamics of d13C-CO2 Bulk soil Bulk litters Rubino et al., in progress
Discrimination during heterotrophic respiration ??? Soil substrate 1:1 J. phaenicia Leaf litter substrate C. mospeliensis P. lentiscus
Partitioning of C loss from decomposing litter into soil C input and respired CO2
Identification of SOM chemical compounds where litter derived C is allocated Rubino et al., in progress
CONCLUSIONS • Coupling of SOM fractionation by size and density and stable C isotope “labelling” proved to be a useful approach to quantify changes in soil organic C pools • Elevated atmospheric CO2 appears to increase soil C losses proportionally more than inputs, resulting in a net decrease of soil C. Is it a true effect or rather due to the“step change” of manipulation studies?? • After 20 years, afforestation increased the total amount of soil C by 23% and 6% in the 0–10 and in the 10–30cm depth layer, respectively. Forest-derived carbon contributed 43% and 31% to the total soil C storage in the afforested systems in the 0–10 and 10–30cm depths, respectively. Furthermore, afforestation resulted in significant sequestration of new C and stabilization of old C in physically protected SOM fractions, associated with microaggregates (53–250 mm) and silt&clay (<53 mm).
I. Del Galdo, G. Battipaglia, T. Bertolini, I. Inglima, M. Rubino, F. Marzaioli, D. Piermatteo, C. Lubritto
APPENDIX Cs(t) = Csv(t)+ Csn(t) s(t)Cs(t)= vCsv(t)+n(t)Csn(t) f’ º Csv(t)/Cs(t) =[s(t)- n(t)]/[v - n(t)] f º Csv(t)/Cs(t) =[s(t)- s(0)]/[v - s(0)] Fr(t) =Frv(t)+Frn(t) rFr(t) = rvFrv(t)+rnFrn(t) Fr(t) [r(t)- s(0)] = Frv(t) [v - n(t)] Frn(t) = ksCsn(t)Frv(t) = Fvkv + ksCsv(t) ks = [Fr(t)/Cs(t)] * [δr(t)- δv]/[δs(t)- δv] Cs(t) - Cs(0)= Csv(t) - ò Frs(t) dt Cs(t) - Cs(0) = Cs(t) [δs(t)- δs(0)]/[ δv - δs(0)] - ò Fr(t) [δr(t)- δv]/[δs(0) - δv] dt Cs(t) - Cs(0) = f · Cs(t) – ò Fr(t) · Rs/Rt dt
SOM DECAY and TURNOVER Six et al. 1998