Download
1 / 18
190 likes | 390 Views
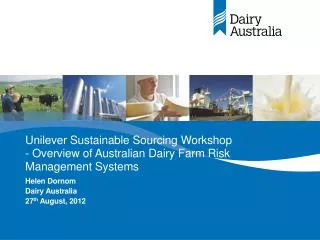
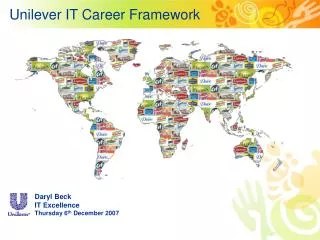
2. Who is Unilever?. Worldwide turnover - € 40.4 billion in 2004 223,000 employees in 100 countries 150 million people buy our products every day Foods brands account for over half our sales. 3. Unilever and Agriculture. 4. Lead Agriculture Programmes. Tea Started 1999

E N D
Who is Unilever? • Worldwide turnover - € 40.4 billion in 2004 • 223,000 employees in 100 countries • 150 million people buy our products every day • Foods brands account for over half our sales 3
Lead Agriculture Programmes • Tea Started 1999 Kenya, Tanzania and India • Palm oil Started 1999 Malaysia (sold in 2002), Ghana and Côte d’Ivoire • Tomatoes Started 1999 Brazil and California 2005 Greece • Spinach and peas Started 1998 UK 2000 Germany and Italy 5
Sustainable Agriculture Strategy • 3 strands • LAPs • Roll-out to suppliers • Extension beyond key crops 6
Indicator Parameter Scores Step 0 Conventional Step 1 Eco-efficiency Step 2 Regenerative Technologies Measuring Improvement - 1997* *Based on Discussion Paper produced for Unilever by Professor Jules Pretty - University of Essex 7
Indicators and Parameters 7. Energy 1. Soil Fertility Health 2. Soil Loss 8. Water 3. Nutrients 9. Social/Human Capital 4. Pest Management 10. Local Economy 5. Biodiversity 11. Animal Welfare 6. Value Chain 8
How... • Baseline measurements • Field and Factory records • Novel in field measurements • Working with experts - NGOs, • Academics 9
What we’ve learnt…1998 - 2004 • We generated a lot of data - complexity • Linking practice to improvement • Supply chain driven - where’s the brand • equity • Prioritization & Pragmatism 10
Nutrients Biodiversity Soil health Value Chain Soil compactionresearch Optimisedfertilisationstrategy Field marginprogramme 2004 to Date:Two Tiers Indicators& Issues Ia Ib Ic Id LAPactivities A1 A2 A3 11
(4) Reference to detailed description (Tier 2) (6) Colour code depending on Profiling Scores (3) Short prose description of LAP response (1) List of potential sustainability issues (by Indicator) (2) Classification of LAP response to issue (Not applicable/relevant, Managed, No action, Not looked at) (5) Scores for three Profiling Criteria (anchored scales); set of criteria used depend on Classification (Column 2) Output 12
Output Flowchart guiding through process 13
Classifi- Total LAP cation 2004 Status POTENTIAL ISSUES 2000 2004 Soil Health and Fertility N.1.a Depletion of soil organic matter Managed 1 2 N.1.b Negative impact on soil physical quality (structure, compaction, infiltrability) Managed ... 1 2 N.1.c Negative impact on soil chemical quality (a) Soil nutrient depletion Managed ... 3 3 (b) Soil acidification/alkalinisation Managed ... 3 3 (c) Soil salinisation Not relevant ... 3 3 (d) Soil chemical contamination (heavy metals, toxins) No action ... 1 1 N.1.d Negative impact on soil biological quality (build-up crop pathogen potential) Managed ... 2 2 Soil Loss and Land Use N.2.a Soil loss (a) Water erosion Managed ... 1 3 (b) Wind erosion Not relevant ... 2 2 (c) Soil removal with harvested product Not applicable ... N.2.b Emission of sediments into water Not relevant ... 2 2 N.2.c Consumption of natural peat or forest soil Not applicable ... Nutrients N.3.a Consumption of non-renewable minerals (a) Phosphate Not applicable ... (b) Potassium No action ... 2 2 N.3.b Emission of eutrophying substances (a) Nitrate Managed ... (b) Phosphate Managed ... (c) Gaseous N (NH3, NOx) Managed ... N.3.c Inefficient nutrient use / cycling Managed ... Pest Management ("pesticides": all biocides, incl. fungicides and herbicides) N.4.a Exposure of non-target organisms/areas to pesticides / decay products Show progress 14
Activity Reports • Highly detailed information • Measurements and Parameters • Methodological and technical information • Environmental, social and business context 15
Where next... • Further prioritization: • Using our 2 tier approach • Review in 2006 • Fewer, but truly performance based indicators • Not forgetting our Tier 1 checklist! 16
www.unilever.com/ourvalues/environmentandsociety/sustainability/agriculturewww.unilever.com/ourvalues/environmentandsociety/sustainability/agriculture 17