Download
1 / 31

E N D
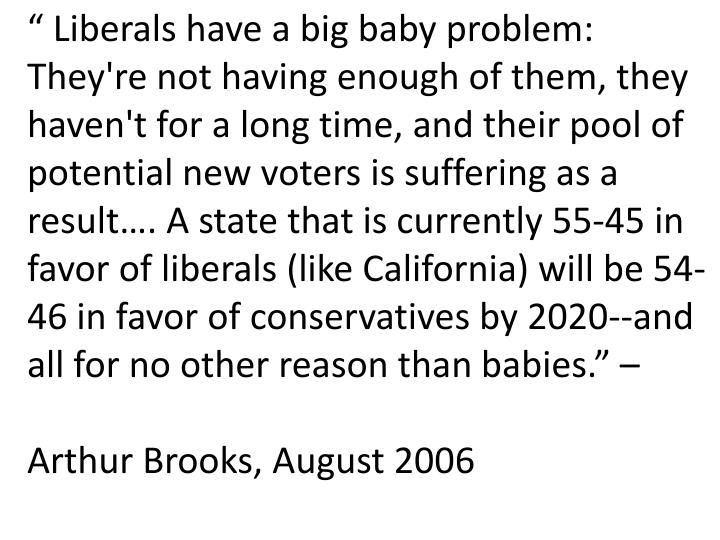
“Liberals have a big baby problem: They're not having enough of them, they haven't for a long time, and their pool of potential new voters is suffering as a result…. A state that is currently 55-45 in favor of liberals (like California) will be 54-46 in favor of conservatives by 2020--and all for no other reason than babies.” – Arthur Brooks, August 2006
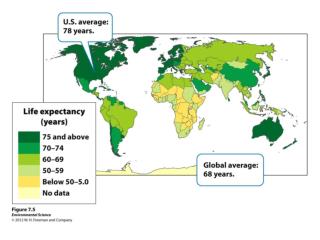
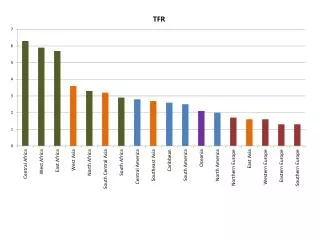
Total Fertility Rates by Country Source: CIA World Fact Book 2008
Direct Effect: Religiosity and Fertility in Europe and USA United States, 2006 (GSS)
Source: Blume, Michael. 2009. 'The Reproductive Benefits of Religious Affiliation'. In The Biological Evolution of Religious Mind and Behavior, edited by E. Voland and W. Schiefenhövel. New York: Springer-Verlag.
UK: A Tale of Two Cities: Salford v Leeds US: American Jews have TFR of 1.43. In 2000-6 alone, Haredim increase from 7.2 to 9.4 pc of total. Kiryas Joel, in Orange Co., New York, nearly triples in population to 18000 between 1990 and 2006
Total Fertility Rate (Average Children per Woman), 2000-2001 Source: Vegard Skirbekk and Anne Goujon, IIASA, World Population Program, 2007-9. * Denotes few observations.
Projected Nonreligious Population of Austria to 2051, 36 Scenarios Source: Goujon et al. 2006
Source: WVS 1999-2000. N = 2796 respondents in towns under 10,000 and 1561 respondents in cities over 100,000. Asked in Algeria, Bangladesh, Indonesia, Jordan, Pakistan, Nigeria and Egypt.
World's Oldest Countries, 2000 and 2050 Country 15-59 60+ 15-59 60+ Italy 61.7 24.1 46.2 42.3 Greece 61.5 23.4 46.2 40.7 Germany 61.2 23.2 49.5 38.1 Japan 62.1 23.2 45.2 42.3 Sweden 59.4 22.4 48.3 37.7 Belgium 60.6 22.1 50.3 35.5 Spain 63.5 21.8 44.5 44.1 Bulgaria 62.6 21.7 47.6 38.6 Switzerland 62.1 21.3 48.6 38.9 Latvia 61.7 20.9 47.5 37.5 Portugal 62.5 20.8 49.9 35.7 Austria 62.6 20.7 47.4 41.0 United Kingdom 60.4 20.6 51.1 34.0 Ukraine 61.6 20.5 49.0 38.1 France 60.7 20.5 51.3 32.7 Estonia 62.1 20.2 48.5 35.9 Croatia 61.8 20.2 53.0 30.8 Denmark 61.8 20.0 53.0 31.8 Finland 62.0 19.9 50.6 34.4 Hungary 63.3 19.7 49.4 36.2 Norway 60.7 19.6 51.7 32.3 Luxembourg 62.0 19.4 57.1 25.2 Slovenia 65.0 19.2 45.1 42.4 Belarus 62.4 18.9 49.6 35.8 Romania 62.9 18.8 50.0 34.2 in 2000 in 2050 Source: Goldstone 2007