Download
1 / 42
420 likes | 425 Views
Learn about network analysis, PERT, CPM, critical path identification, project cost analysis, and project crashing in this comprehensive guide to project management.

E N D
UNIT-VI Project Management (PERT/CPM) PREPARED BY CH. AVINASH
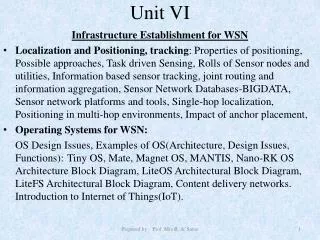
INDEX UNIT 6 PPT SLIDES S.NO. TOPIC LECTURE NO. • Project Management ( PERT/CPM) L1 • Network Analysis L2 • Programme Evaluation and Review Technique L3 • (PERT), Critical Path Method ( CPM ), Identify L4 • Critical Path, Probability of Completing the Project L5 • Within given time, Project Cost Analysis L6 • Project Crashing, (simple problems) L7
Project Planning Given: Statement of work written description of goals work & time frame of project Work Breakdown Structure Be able to: develop precedence relationship diagram which shows sequential relationship of project activities 3
Gantt Chart Popular tool for project scheduling Graph with bar representing time for each task Provides visual display of project schedule Also shows slack for activities (amount of time activity can be delayed without delaying project) 4
A Gantt Chart Month 0 4 2 6 8 10 ½ ½ ½ ½ ½ Activity Design house and obtain financing Lay foundation Order and receive materials Build house Select paint Select carpet Finish work ½ ½ ½ ½ ½ 1 3 5 7 9 5
CPM/PERT Critical Path Method (CPM) - DuPont & Remington-Rand (1956) - deterministic task times - activity-on-node network construction (AON) Project Evaluation & Review Technique (PERT) - U.S. Navy, Booz, Allen & Hamilton - multiple task time estimates( probabilistic) - activity-on-arrow network construction (AOA) 6
Network Construction In AON, nodes represent activities & arrows show precedence relationships In AOA, arrows represent activities & nodes are events for points in time An event is the completion or beginning of an activity A dummy shows precedence for two activities with same start & end nodes 7
The Project Network Network consists of branches & nodes 1 2 3 Node Branch 8
Simplified Project Network 1 2 3 Construct forms Pour concrete 9
Consider the following table which describes the activities to be done to build a house and its sequence Activity predecessors Duration A Design house and obtain financing - 3 B Lay foundation A 2 C Order and receive materials A 1 D Build house B,C 3 E Select paint B,C 1 F Select carpet E 1 G Finish work D,F 1 10
Concurrent Activities Lay foundation 3 2 Order material 3 Lay foundation Dummy 2 4 Order material Incorrect precedence relationship Correct precedence relationship 11
Project Network For A House 3 Dummy Lay foundation 0 Build house Finish work 2 3 1 7 6 1 2 4 1 3 Order and receive materials Design house and obtain financing 1 1 Select paint Select carpet 5 12
Critical Path A path is a sequence of connected activities running from the start to the end node in a network The critical path is the path with the longest duration in the network A project cannot be completed in less than the time of the critical path (under normal circumstances) 13
All Possible Paths path1: 1-2-3-4-6-7 3 + 2 + 0 + 3 + 1 = 9 months; the critical path path2: 1-2-3-4-5-6-7 3 + 2 + 0 + 1 + 1 + 1 = 8 months path3: 1-2-4-6-7 3 + 1 + 3 + 1 = 8 months path4: 1-2-4-5-6-7 3 + 1 + 1 + 1 + 1 = 7 months 14
Early Times(House building example) ES - earliest time activity can start Forward pass starts at beginning of network to determine ES times EF = ES + activity time ESij = maximum (EFi) EFij = ESij + tij ES12 = 0 EF12 = ES12 + t12 = 0 + 3 = 3 months i j 15
Computing Early Times -ES23 = max (EF2) = 3 months - ES46 = max (EF4) = max (5,4) = 5 months - EF46 = ES46 + t46 = 5 + 3 = 8 months - EF67 =9 months, the project duration 16
Late Times LS - latest time activity can be started without delaying the project Backward pass starts at end of network to determine LS times LF - latest time activity can be completed without delaying the project LSij = LFij - tij LFij = minimum (LSj) 17
Computing Late Times If a deadline is not given take LF of the project to be EF of the last activity LF67 = 9 months LS67 = LF67 - t67 = 9 - 1 = 8 months LF56 = minimum (LS6) = 8 months LS56 = LF56 - t56 = 8 - 1 = 7 months LF24 = minimum (LS4) = min(5, 6) = 5 months LS24 = LF24 - t24 = 5 - 1 = 4 months 18
Project cost analysis:- ES=5, EF=5 LS=5, LF=5 ES=3, EF=5 LS=3, LF=5 ES=8, EF=9 LS=8, LF=9 ES=5, EF=8 LS=5, LF=8 ES=3, EF=4 LS=4, LF=5 ES=0, EF=3 LS=0, LF=3 ES=6, EF=7 LS=7, LF=8 ES=5, EF=6 LS=6, LF=7 3 0 2 3 1 7 6 1 2 4 3 1 1 1 5 19
Activity Slack Slack is defined as the LS-ES or LF-EF Activities on critical path have ES = LS & EF = LF (slack is 0) Activities not on critical path have slack Sij = LSij - ESij Sij = LFij - EFij S24 = LS24 - ES24 = 4 - 3 = 1 month 20
Total slack/float or Slack of an activity Total slack/ float means the amount of time that an activity can be delayed without affecting the entire project completion time. The activity on a given path share the maximum possible slack of the activity along that path according to its share. Sum of the possible slacks of the activities can not exceed the maximum slack along that path. 21
Free slack of an activity This is the maximum possible delay of an activity which does not affect its immediate successors. This is evaluated as FSij = ESj – EFij 22
Activity Slack Data Activity ES LS EF LF Slack (S) Free slack 1-2* 0 0 3 3 0 0 2-3 3 3 5 5 0 0 2-4 3 4 4 5 1 1 3-4* 5 5 5 5 0 0 4-5 5 6 6 7 1 0 4-6* 5 5 8 8 0 0 5-6 6 7 7 8 1 1 6-7* 8 8 9 9 0 0 * Critical path 23
Probability of completing the project within given time:- Activity Design house and obtain financing Lay foundation Order and receive materials Build house Select paint Select carpet Finish work 0 2 4 6 8 10 1 3 5 7 9 24
Probabilistic Time Estimates Reflect uncertainty of activity times Beta distribution is used in PERT a + 4m + b t = Mean (expected time): 6 b - a ( ) Variance: s 2 = 6 2 where, a = optimistic estimate m = most likely time estimate b = pessimistic time estimate 25
Example Beta Distributions P (time) P (time) m t a b a t m b P (time) a b m = t 26
PERT Example Equipment testing and modification 2 6 Final debugging Dummy Equipment installation System Training 1 3 5 8 9 System development Manual Testing System changeover System Testing Job training Dummy Position recruiting Orientation 4 7 27
Activity Information Time estimates (wks) Mean Time Variance Activity a m b t s2 1 - 2 6 8 10 8 .44 1 - 3 3 6 9 6 1.00 1 - 4 1 3 5 3 .44 2 - 5 0 0 0 0 .00 2 - 6 2 4 12 5 2.78 3 - 5 2 3 4 3 .11 4 - 5 3 4 5 4 .11 4 - 7 2 2 2 2 .00 5 - 8 3 7 11 7 1.78 5 - 7 2 4 6 4 .44 7 - 8 0 0 0 0 .00 6 - 9 1 4 7 4 1.00 8 - 9 1 10 13 9 4.00 28
Early And Late Times 1 - 2 8 0.44 0 8 1 9 1 1 - 3 6 1.00 0 6 0 6 0 1 - 4 3 0.44 0 3 2 5 2 2 - 5 0 0.00 8 8 9 9 1 2 - 6 5 2.78 8 13 16 21 8 3 - 5 3 0.11 6 9 6 9 0 4 - 5 4 0.11 3 7 5 9 2 4 - 7 2 0.00 3 5 14 16 11 5 - 8 7 1.78 9 16 9 16 0 5 - 7 4 0.44 9 13 12 16 3 7 - 8 0 0.00 13 13 16 16 3 6 - 9 4 1.00 13 17 21 25 8 8 - 9 9 4.00 16 25 16 25 0 Activity t s2 ES EF LS LF S FS? 29
Network With Times ES=8, EF=13 LS=16 LF=21 ( ) ES=0, EF=8 LS=1, LF=9 ES=13, EF=17 LS=21 LF=25 ( ) ( ) ES=8, EF=8 LS=9, LF=9 ( ) ES=0, EF=6 LS=0, LF=6 ES=9, EF=16 LS=9, LF=16 ( ) ( ) ES=6, EF=9 LS=6, LF=9 ES=16, EF=25 LS=16 LF=25 ( ) ( ) ES=9, EF=13 LS=12, LF=16 ( ) ES=0, EF=3 LS=2, LF=5 ( ) ES=13, EF=13 LS=16 LF=16 ES=3, EF=7 LS=5, LF=9 ( ) ( ) ES=3, EF=5 LS=14, LF=16 ( ) 2 6 5 8 4 0 3 9 8 1 3 5 9 6 7 0 4 3 4 2 4 7 30
Project Variance Project variance is the sum of the variances along the critical path s2 = s2 13 + s2 35 + s2 58 + s2 89 = 1.00 +0.11 + 1.78 + 4.00 = 6.89 weeks 31
Probabilistic Network Analysis Determine the probability that a project is completed (project completion time is ) within a specified period of time where m = tp = project mean time s = project standard deviation x = project time (random variable) Z = number of standard deviations of x from the mean (standardized random variable) x - m Z = s 32
Normal Distribution Of Project Time Probability Zs m = tp x Time 33
Standard Normal Distribution Of transformed Project Time Probability Z m =0 z Time 34
Probabilistic Analysis Example What is the probability that the project is completed within 30 weeks? P(X 30) = ? s2 = 6.89 weeks s= 6.89 = 2.62 weeks Z = x - m =30 - 25 = 1.91 P(Z 1.91) = ? s 2.62 35
. . . . . . . . . Determining Probability From Z Value Z 0.00 0.01 .. 04 … 0.09 1.1 0.3643 0.3665 0.3729 1.9 0.4713 …0.4767 +0.4719 P( x < 30 weeks) = 0.50+ 04719 = 0.9719 m = 25 x = 30 Time (weeks) 36
What is the probability that the project will be completed within 22 weeks? 22 - 25 -3 2.62 2.62 = = -1.14 Z = P(Z< -1.14) = 0.1271 x = 22 m = 25 x=28 Time (weeks) P( x< 22 weeks) = 0.1271 37
Benefits of PERT/CPM Useful at many stages of project management Mathematically simple Uses graphical displays Gives critical path & slack time Provides project documentation Useful in monitoring costs 38
Networks generated provide valuable project documentation and graphically point out who is responsible for various project activities Applicable to a wide variety of projects and industries Useful in monitoring not only schedules, but costs as well Advantages of PERT/CPM 39
Assumes clearly defined, independent, & stable activities Specified precedence relationships Activity times (PERT) follow beta distribution Subjective time estimates Over-emphasis on critical path Limitations of PERT/CPM 40
Identifying Critical path:- 3 Dummy Lay foundation 0 Build house Finish work 2 3 1 7 6 1 2 4 1 3 Order and receive materials Design house and obtain financing 1 1 Select paint Select carpet 5 41
Project crashing:- • When the two methods like work study, trade off and other possible ones fail, we go for crashing. • Crashing includes: Normal cost Normal Time Crash cost Crash Time Direct cost Indirect cost optimization cost