Download
1 / 16
350 likes | 852 Views
V h. g. g. L. V V. V . Horizon. D. g. V . W. Gliding Path - Drift down. Consider an airplane in a power-off glide as shown below: Note that by convention the descent angle is defined as being positive. So, we will use: g = - g . g. H. R. Gliding Path (continued).

E N D
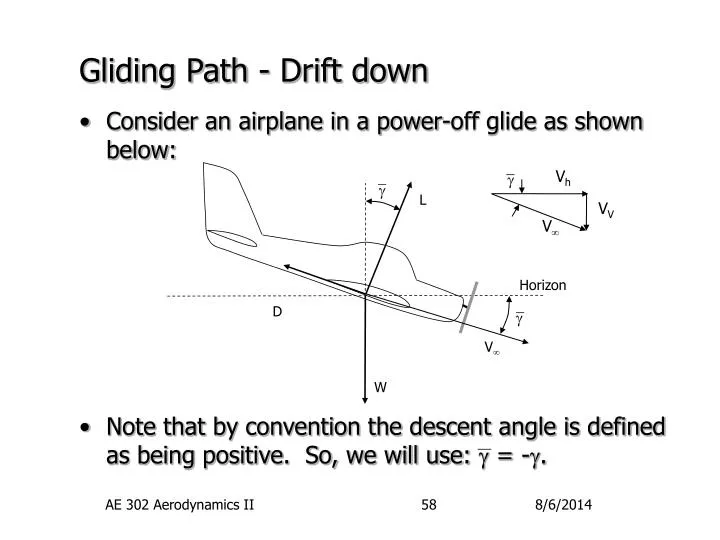
Vh g g L VV V Horizon D g V W Gliding Path - Drift down • Consider an airplane in a power-off glide as shown below: • Note that by convention the descent angle is defined as being positive. So, we will use: g = -g. AE 302 Aerodynamics II
g H R Gliding Path (continued) • The force balance this time yields: • Or by dividing the two equations: • Thus, the minimum glide slope angle occurs for a maximum L/D! • Note that gmin provides for the longest distance traveled in a glide from altitude. AE 302 Aerodynamics II
Gliding Path (continued) • For maximum time aloft, we want the minimum vertical velocity, Vv • To get this, multiply our drag equation by V: or • Thus, for a minimum vertical velocity, we want a minimum in the required power, PR! • By our previous calculations, this occurs when: AE 302 Aerodynamics II
g L T V g Horizon D V g VV = R/C =V sing W Vh Rate of Climb • Consider now an airplane in steady, unaccelerated, climbing flight: • The vertical component of velocity is called the rate of climb, R/C (often given in the non-standard units of feet per minute, fpm). AE 302 Aerodynamics II
Rate of Climb (continued) • A force balance parallel and perpendicular to the flight path yields: • the primary difference from level flight being the weight contribution in the flight direction • Rearranging the first equation gives: • or after multiplying by velocity: AE 302 Aerodynamics II
PA=TV P excess power Piston- Propeller PR=DV V Rate of Climb (continued) • Thus, the rate of climb is proportional to the difference between the power available, TV, and the power required for level flight, DV. • This difference is called the excess power: • Graphically, the excess power is the distance between the power available and power required curves AE 302 Aerodynamics II
Rate of Climb (continued) • A little word of caution about using these charts: • The power required curve shown is that for level, unaccelerated flight. • However, the drag depends upon the lift which in climbing flight is slightly lower than in level flight since L=W cosg • The power required curve thus depends upon the angle of climb - but we cannot calculate the excess power and the angle of climb until we first have the power required! • For small climb angles, cosg ~ 1, so L~W. Thus, we don’t have to worry about this discrepancy. • For large climb angles, the original force balance equations must be solve to yield a relationship between V and g for given values of T. AE 302 Aerodynamics II
Maximum PA P Maximum excess power PR R/C V R/Cmax V Vmax R/C Vmax Rate of Climb (continued) • The maximum rate of climb occurs for the highest throttle setting and at a velocity such that excess power is a maximum. • Another way to represent this is to plot the rate of climb versus flight velocity. • The maximum R/C and the corresponding velocity are easily seen. AE 302 Aerodynamics II
Hodograph Diagram Vv Vv,max=R/Cmax V gmax g Vh Rate of Climb (continued) • Also of interest is the maximum flight path angle - useful if we want clear obstacles. • To find this, change the axis on the previous plot to the horizontal velocity - a so-called hodograph diagram. • A line to any point on this curve represents the flight velocity and angle. • The tangent line shown will have the steepest flight path angle (note how close to stall it is!) AE 302 Aerodynamics II
Piston-Propeller Turbojet P P PA tangent to PA PA excess power excess power PR PR V V Rate of Climb (continued) • One final note concerns the difference between turbojets and piston-propellers. • The two sketches below show that at low speeds, piston-propellers have a higher level of excess power. • This add a comfort margin in propeller driven aircraft since all planes normally land near their stall speeds! AE 302 Aerodynamics II
PR at sea level P PA at sea level PR at altitude Maximum excess power PA at altitude V Ceilings • Let’s review the altitude on effects on power available and power required. • PA decreases with , while PR increases by (1/)1/2 • As a result, the maximum excess power, and thus the maximum rate of climb, decreases with altitude! AE 302 Aerodynamics II
P PR at absolute ceiling V Ceilings (continued) • At some altitude, the maximum excess power becomes zero. • This situation is the maximum possible flight altitude of the aircraft - the absolute ceiling! • While it is possible for an aircraft to achieve this altitude, the aircraft is unstable at this condition and it is difficult, if not actually unsafe, to fly there. PA at absolute ceiling AE 302 Aerodynamics II
h Absolute ceiling Service ceiling R/C (fpm) 0 100 fpm R/Csl Ceilings (continued) • A more practical ceiling for an aircraft is that alitude at which the rate of climb is reduced to 100 fpm - the service ceiling! • For commercial jet transports, the service ceiling is even more restrictive - a 500 fpm rate of climb is required. AE 302 Aerodynamics II
Ceilings (continued) • One final note: a quick estimate of the absolute ceiling of a propeller airplane may be made by noticing that at this condition, PA ~ PR,min. • Using our altitude correction formulae: • Thus, the density ratio at the absolute ceiling can be estimated from the power ratio at sea level. AE 302 Aerodynamics II
Time to climb • The time to climb from one altitude to another may be calculated once the rate of climb is known. • Unfortunately, since R/C varies with altitude, the necessary calculation is an integration as indicated by: • Thus, the R/C must be determined at a number of altitudes in the range between h1 and h2 • A plot of (R/C)-1 can then be numerically or graphically integrated to get time. AE 302 Aerodynamics II
(R/C)-1 (m/ft) Time to climb = area under curve h 0 h1=0 h2 Time to climb (continued) AE 302 Aerodynamics II