Download
1 / 16
160 likes | 343 Views
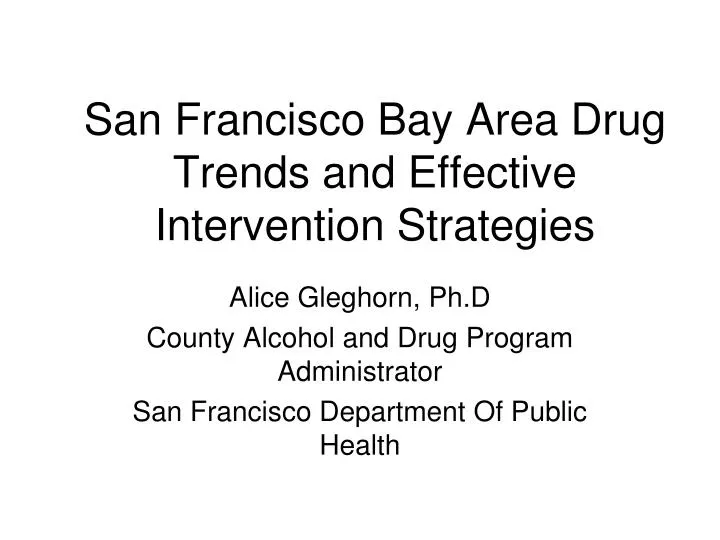
San Francisco Bay Area Drug Trends and Effective Intervention Strategies. Alice Gleghorn, Ph.D County Alcohol and Drug Program Administrator San Francisco Department Of Public Health. HEROIN PRICE* AND PURITY *Price unit = per milligram pure. $1.40 10%

E N D
San Francisco Bay Area Drug Trends and Effective Intervention Strategies Alice Gleghorn, Ph.D County Alcohol and Drug Program Administrator San Francisco Department Of Public Health
HEROIN PRICE* AND PURITY*Price unit = per milligram pure $1.40 10% $0.99 12% $0.98 11% $0.98 11% $0.89 12% $0.69 10% $1.28 8% $1.07 7.8% 2009 $2.09 5.8% 2010 $2.32 5.7% 2011 $1.40 3.9% Source: DEA 2011 Heroin DMP, March 2011
Lab analysis of “Gunpowder” sample in 2012 found heroin, lidocaine, codeine, and morphine
San Francisco ED Reports 2004-2011 Source: DAWN 2011(weighted data)
San Francisco ED Reports 2004-2011, % changeSource: DAWN 2011 Drug Abuse Warning Network, 2011: Selected Tables of National Estimates of Drug-Related Emergency Department Visits. Rockville, MD: Center for Behavioral Health Statistics and Quality, SAMHSA, 2013
5 Bay Area Counties: 2012 Prescription Quantities By Drug Name
5 Bay Area Counties: Prescription QuantitiesHydrocodone/APAP CURES Data provided by Mike Small, CA DOJ
Primary Drug Treatment Problem: Percent of total admissions5 Bay Area Counties; FY2012-13 Source: DHCS 12-19-13 CalOMS Data System, Craig Chaffee
San Francisco Treatment Service Episode by Primary Drug Problem : FY0607 through FY1112(Source: CBHS BIS Admission Data)
SAN FRANCISCO COUNTY PRIMARY DRUG AT TREATMENT ADMISSION PERCENTAGE BY AGE, 2011-12[I] [i]Source: CalOMS Tx Data, Department of Alcohol and Drug Programs
1997: Treatment On Demand • Treatment Expansion: Significant, sustained local funding increase • Commitment to Harm Reduction approach: Reaching people wherever they are to reduce death and drug-related harm • “Heroin Issues” subcommittee: • 1. Hep C Prevention • 2. Alternative Treatment modalities • 3. Soft-Tissue Infection • 4. OVERDOSE DEATH PREVENTION
TOD Heroin Issues Committee Actions: • 1) Train Community Outreach & Syringe Exchange on overdose preventioneducation • 2) Conduct broad public education campaign to increase overdose awareness • 3) Target overdose responsetraining for people at-risk of heroin overdose in jails, probation, and drug treatment programs • 4) Test the feasibility and effectiveness of training heroin users to administer naloxone as anoverdose death prevention tool
Drug Overdose Prevention Education (DOPE) Focus • Overdose Risk Factors • Recognizing Overdose signs • Overdose response: • Call 911, Rescue Breathing, Recovery Position,& Follow Up Medical care • Naloxone Pilot Program • 2003- Naloxone distribution and refills • 2010 – Intra-Nasal device • Target populations • SROs, Jail, SEPs, • Residential and Opiate Treatment Programs • AB 109 (Prisoners released to communities) • Pharmacy/Primary Care, Pain medication
Deaths Involving Drug Abuse – DAWN SF Metropolitan Area -1994-2002 Source: Office of Applied Studies, SAMHSA, Drug Abuse Warning Network, 2002 (092003 update) • Heroin deaths: 1997= 297; 2010= 8