Download
1 / 1
10 likes | 106 Views
No data. Daily Snow Water Equivalent (mm). SAR-based Open Water Classification for the Ob River Region. JERS SAR Backscatter Classification of Lake Valdai Region. Water. Low. Low medium. Medium. Medium high. High. Surface Runoff (mm/day). ERS-1. JERS-1. backscatter. ERS-2. Coherence.

E N D
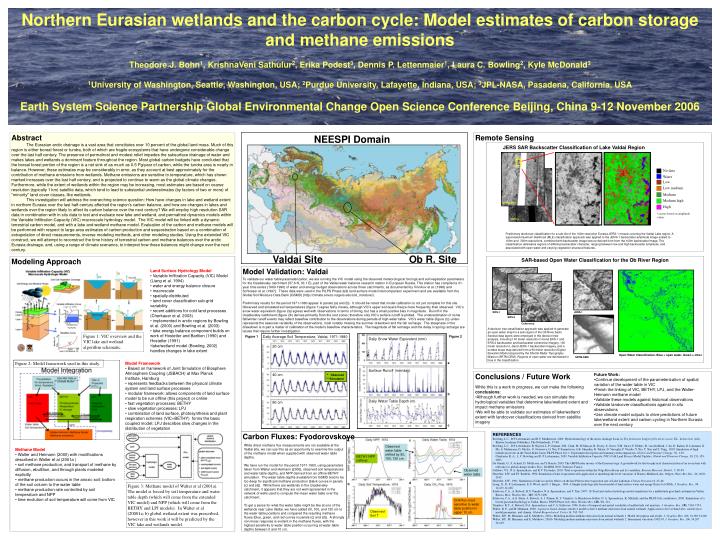
No data Daily Snow Water Equivalent (mm) SAR-based Open Water Classification for the Ob River Region JERS SAR Backscatter Classification of Lake Valdai Region Water Low Low medium Medium Medium high High Surface Runoff (mm/day) ERS-1 JERS-1 backscatter ERS-2 Coherence *classes based on amplitude values A decision tree classification approach was applied to generate an open water map for a sub-region of the Ob River basin. Several data layers were employed in the decision tree analysis, including 100 meter resolution C-band ERS-1 and ERS-2 backscatter and backscatter coherence imagery, 100 meter resolution L-band JERS-1 backscatter imagery, and a surface slope map derived from a 90 meter resolution Digital Elevation Model acquired by the Shuttle Radar Topography Mission (SRTM DEM). Regions of open water are delineated in blue in the classification. Daily Water Table Depth (m) texture Preliminary landcover classification for a sub-tile of the 100m resolution Eurasia JERS-1 mosaic covering the Valdai Lake region. A supervised maximum likelihood (MLE) classification approach was applied to the JERS-1 backscatter amplitude image scaled to 100m and 300m resolutions, combined with backscatter image texture derived from from the 100m backscatter image. The classification delineates regions of differing backscatter character, ranging between low and high backscatter amplitude, and associated with open water and varying vegetation structural features. Open Water Classification. Blue = open water. Green = other SRTM DEM Model Validation: Valdai To validate our water table parameterization, we are running the VIC model using the observed meteorological forcings and soil/vegetation parameters for the Usadievskiy catchment (57.6 N, 33.1 E), part of the Valdai water-balance research station in European Russia. This station has compiled a 31-year time series (1960-1990) of water and energy budget observations across three catchments, as documented by Vinnikov et al. (1996) and Schlosser et al. (1997). These data were used in the PILPS Phase 2(d) land surface model intercomparison experiment and are available from the Global Soil Moisture Data Bank (GSMD) (http://climate.envsci.rutgers.edu/soil_moisture/). Preliminary results for the period 1971-1980 appear in panels (a) and (b). It should be noted that model calibration is not yet complete for this site. Observed and simulated soil temperatures (figure 1) agree fairly closely, although VIC’s upper soil layers freeze more frequently than observed. VIC’s snow water equivalent (figure 2a) agrees well with observations in terms of timing, but has a small positive bias in magnitude. Runoff in the Usadievskiy catchment (figure 2b) derives primarily from the root zones; therefore only VIC’s surface runoff is plotted. The underestimation of some fall/winter runoff events may reflect baseflow contribution to the observations during periods of high water table. VIC’s water table (figure 2c) under-represents the seasonal variability of the observations, most notably missing the summer drawdown and the fall recharge. The steepness of the drawdown is in part a matter of calibration of the model’s baseflow characteristics. The magnitude of fall recharge and the delay in spring recharge are issues that require further investigation. Figure 1: VIC overview and the VIC lake and wetland algorithm schematic. Daily Average Soil Temperature, Valdai, 1971-1980 20 cm 40 cm Observed Simulated 80 cm Observed water table shifted by 80, 100, 120 cm BETHY NPP (offline) Observed water table Figure 3: Methane model of Walter et al (2001a). The model is forced by soil temperature and water table depth (which will come from the extended VIC model) and NPP (which will come from the BETHY and LPJ models). In Walter et al (20001a; b) global wetland extent was prescribed, however in this work it will be predicted by the VIC lake and wetlands model. CH4 flux most sensitive to water table position in upper 10 cm Observed Soil T Northern Eurasian wetlands and the carbon cycle: Model estimates of carbon storage and methane emissions Theodore J. Bohn1, KrishnaVeni Sathulur2, Erika Podest3, Dennis P. Lettenmaier1, Laura C. Bowling2, Kyle McDonald3 1University of Washington, Seattle, Washington, USA; 2Purdue University, Lafayette, Indiana, USA; 3JPL-NASA, Pasadena, California, USA Earth System Science Partnership Global Environmental Change Open Science Conference Beijing, China 9-12 November 2006 Abstract The Eurasian arctic drainage is a vast area that constitutes over 10 percent of the global land mass. Much of this region is either boreal forest or tundra, both of which are fragile ecosystems that have undergone considerable change over the last half century. The presence of permafrost and modest relief impedes the subsurface drainage of water and makes lakes and wetlands a dominant feature throughout the region. Most global carbon budgets have concluded that the boreal forest portion of the region is a net sink of as much as 0.5 Pg/year of carbon, while the tundra area is nearly in balance. However, these estimates may be considerably in error, as they account at best approximately for the contribution of methane emissions from wetlands. Methane emissions are sensitive to temperature, which has shown marked increases over the last half century, and is projected to continue to warm as the global climate changes. Furthermore, while the extent of wetlands within the region may be increasing, most estimates are based on coarse resolution (typically 1 km) satellite data, which tend to lead to substantial underestimates (by factors of two or more) of "minority" land cover classes, like wetlands. This investigation will address the overarching science question: How have changes in lake and wetland extent in northern Eurasia over the last half-century affected the region's carbon balance, and how are changes in lakes and wetlands over the region likely to affect its carbon balance over the next century? We will employ high resolution SAR data in combination with in situ data to test and evaluate new lake and wetland, and permafrost dynamics models within the Variable Infiltration Capacity (VIC) macroscale hydrology model. The VIC model will be linked with a dynamic terrestrial carbon model, and with a lake and wetland methane model. Evaluation of the carbon and methane models will be performed with respect to large area estimates of carbon production and sequestration based on a combination of extrapolation of direct measurements, inverse modeling methods, and other modeling studies. Using the extended VIC construct, we will attempt to reconstruct the time history of terrestrial carbon and methane balances over the arctic Eurasia drainage, and, using a range of climate scenarios, to interpret how these balances might change over the next century. NEESPI Domain Remote Sensing Valdai Site Ob R. Site Modeling Approach • Land Surface Hydrology Model • Variable Infiltration Capacity (VIC) Model (Liang et al. 1994) • water and energy balance closure • macroscale • spatially-distributed • land cover classification sub-grid variability • recent additions for cold land processes (Cherkauer et al. 2003) • implemented in arctic regions by Bowling et al. (2000) and Bowling et al. (2003) • lake energy balance component builds on work of Hostetler and Bartlien (1990) and Hostetler (1991) • lake/wetland model (Bowling, 2002) handles changes in lake extent Figure 1 Figure 2 Figure 2: Model framework used in this study. • Model Framework • Based on framework of Joint Simulation of Biosphere Atmosphere Coupling (JSBACH) at Max Planck Institute, Hamburg • represents feedbacks between the physical climate system and land surface processes • modular framework: allows components of land surface model to be run offline (this project) or online • fast vegetation processes: BETHY • slow vegetation processes: LPJ • combination of land surface, photosynthesis and plant respiration schemes (VIC+BETHY) forms the basic coupled model; LPJ describes slow changes in the distribution of vegetation a Conclusions / Future Work • Future Work: • Continue development of the parameterization of spatial variation of the water table in VIC • Finish the linking of VIC, BETHY, LPJ, and the Walter-Heimann methane model • Validate these models against historical observations • Validate landcover classifications against in situ observations • Use climate model outputs to drive predictions of future lake/wetland extent and carbon cycling in Northern Eurasia over the next century • While this is a work in progress, we can make the following conclusions: • Although further work is needed, we can simulate the hydrological variables that determine lake/wetland extent and impact methane emissions • We will be able to validate our estimates of lake/wetland extent with landcover classifications derived from satellite imagery b c Carbon Fluxes: Fyodorovskoye REFERENCES Bowling, L.C., D.P. Lettenmaier and B.V. Matheussen, 2000. Hydroclimatology of the Arctic drainage basin, in The freshwater budget of the Arctic ocean, E.L. Lewis et al. (eds), Kluwer Academic Publishers, The Netherlands, 57-90. Bowling, L.C., D.P. Lettenmaier, B. Nijssen, L.P. Graham, D.B. Clark, M. El Maayar, R. Essery, S. Goers, Y.M. Gusev, F. Habets, B. van den Hurk, J. Jin, D. Kahan, D. Lohmann, X. Ma, S. Mahanama, D. Mocko, O. Nasonova, G. Niu, P. Samuelsson, A.B. Shmakin, K. Takata, D. Verseghy, P. Viterbo, Y. Xia, Y. Xue and Z. Yang, 2003. Simulation of high latitude processes in the Torne-Kalix basin: PILPS Phase 2(e) 1: Experiment description and summary intercomparisons, Global and Planetary Change, 38, 1-30. Cherkauer, K. A., L. C. Bowling and D. P. Lettenmaier, 2003. Variable Infiltration Capacity (VIC) Cold Land Process Model Updates, Global and Planetary Change, 38, 151-159, 2003. De Grandi, G., F. Achard, D. Mollicone, and Y. Rauste, 2003. The GBFM radar mosaic of the Eurasian taiga: A groundwork for the bio-physical characterization of an ecosystem with relevance to global change studies, Proc. IGARSS 2003, Toulouse, France. Golubev, V.S., N.A. Speranskaya, and K.V. Tsytsenko, 2003. Total evaporation within the Volga River Basin and its variability, Russian Meteorol. Hydrol., 7, 89-99. Hostetler, S.W. and P.J. Bartlein, 1990. Simulation of lake evaporation with application to modeling lake level variations of Harney-Malheur Lake, Oregon, Water Res. Res., 26, 2603- 2612. Hostetler, S.W., 1991. Simulation of lake ice and its effects on the late-Pleistocene evaporation rate of Lake Lahontan, Climate Dynamics 6, 43-48. Liang, X., D. P. Lettenmaier, E. F. Wood, and S. J. Burges, 1994. A Simple hydrologically-based model of land surface water and energy fluxes for GSMs, J. Geophys. Res., 99, 14,415-14,428. Schlosser, C.A., A. Robock, K.Y. Vinnikov, N.A. Speranskaya, and Y. Xue, 1997. 18-Year land-surface hydrology model simulations for a midlatitude grassland catchment in Valdai, Russia. Mon. Weather Rev., 125, 3279-3296. Schlosser, C.A., A.G. Slater, A. Robock, A. J. Pitman, K. Y. Vinnikov, A. Henderson-Sellers, N. A. Speranskaya, K. Mitchell, and the PILPS 2(d) contributors, 2000: Simulations of a boreal grassland hydrology at Valdai, Russia: PILPS Phase 2(d). Mon. Weather Rev, 128, 301-321. Vinnikov, K.Y., A. Robock, N.A. Speranskaya, and C.A. Schlosser, 1996. Scales of temporal and spatial variability of midlatitude soil moisture. J. Geophys. Res., 101, 7163-7174. Walter, B. P., and M. Heimann, 2000. A process-based, climate-sensitive model to derive methane emissions from natural wetlands: Application to five wetland sites, sensitivity to model parameters, and climate, Global Biogeocheical. Cycles 14, 745–765. Walter, B.P., M. Heimann, and E. Matthews, 2001a Modeling modern methane emissions from natural wetlands 1. Model description and results, J. Geophys. Res. 106, 34,189 34,206 Walter, B.P., M. Heimann, and E. Matthews, 2001b Modeling modern methane emissions from natural wetlands 2. Interannual variations 1982-93, J. Geophys. Res. 106, 34,207 34,219. a c While direct methane flux measurements are not available at the Valdai site, we can use this as an opportunity to examine the output of the methane model when supplied with observed water table depths. We have run the model for the period 1971-1980, using parameters taken from Walter and Heimann (2000), observed soil temperatures and water table depths, and NPP derived from an offline BETHY simulation. The water table depths available from GSMD tend to be too deep for significant methane production (black curves in panels (c) and (d)). While there are wetlands in the Usadievskiy catchment, it appears that they are not well represented in the network of wells used to compute the mean water table over the catchment. To get a sense for what the water table might be like at one of the wetlands near Lake Valdai, we have added 80, 100, and 120 cm to the water table positions and compared the resulting methane fluxes (blue, green, and red curves in panels (c) and (d)). A strongly non-linear response is evident in the methane fluxes, with the highest sensitivity to water table position occurring at water table depths between 0 and 10 cm. • Methane Model • Walter and Heimann(2000) with modifications described in Walter et al (2001a ) • soil methane production, and transport of methane by diffusion, ebullition, and through plants modeled explicitly • methane production occurs in the anoxic soil: bottom of the soil column to the water table • methane production rate controlled by soil temperature and NPP • time evolution of soil temperature will come from VIC d b