Download
1 / 6
60 likes | 149 Views
The polyphenylene sulfide market study reviews, analyzes and projects the global market for polyphenylene sulfide for the period 2012-2022 while discussing the global PPS resin installed capacities. Global market for polyphenylene sulfide product types analyzed in the report include PPS compounds and other PPS products such as fibers, films and coatings.<br>

E N D
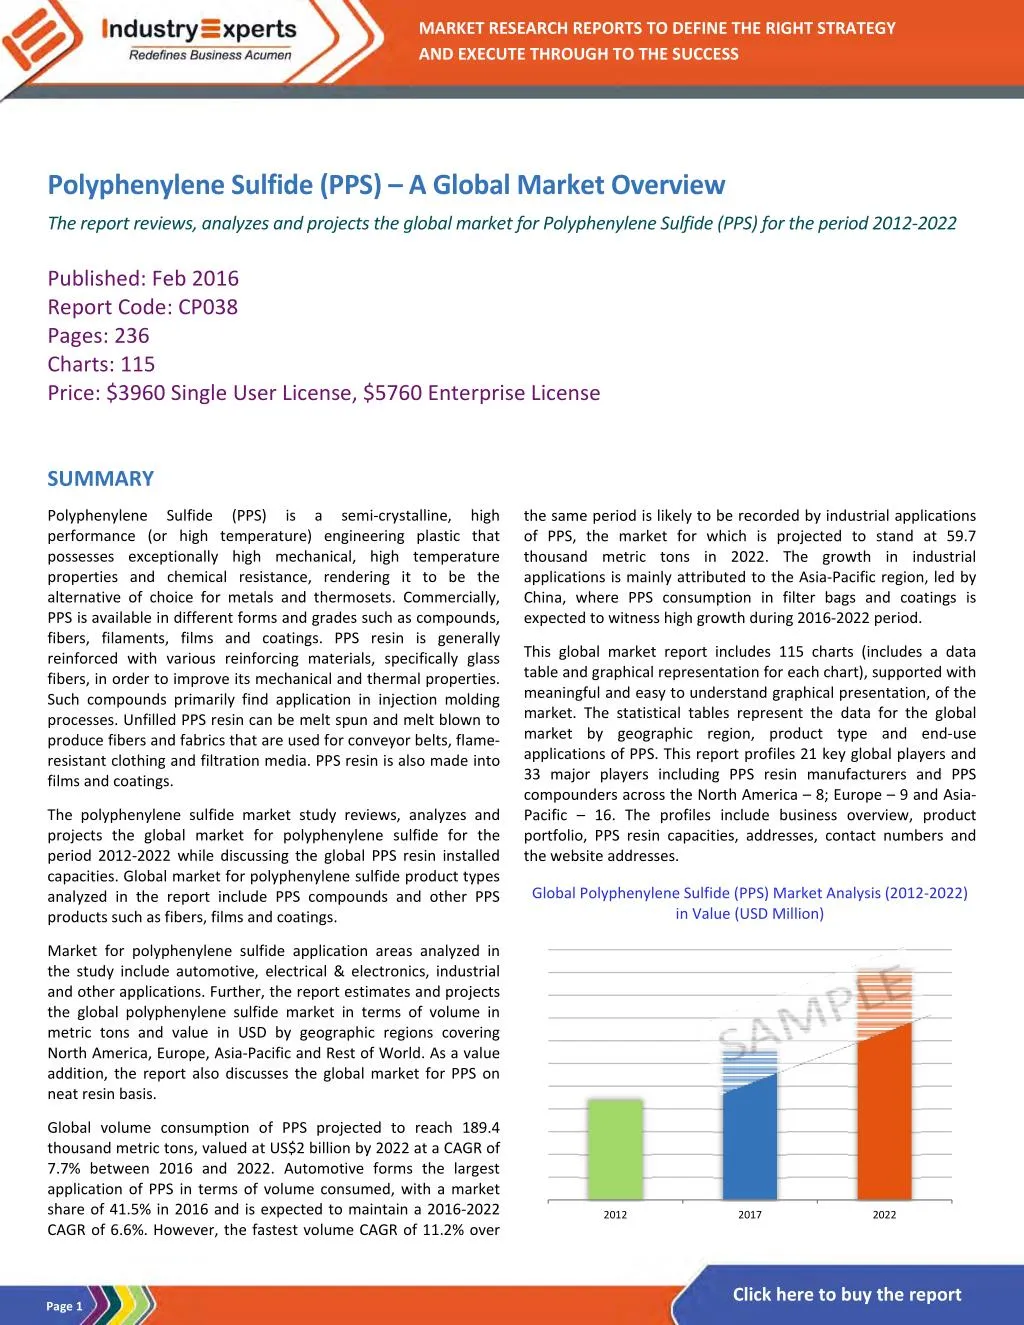
MARKET RESEARCH REPORTS TO DEFINE THE RIGHT STRATEGY MARKET RESEARCH REPORTS TO DEFINE THE RIGHT STRATEGY AND EXECUTE THROUGH TO THE SUCCESS Polyphenylene Sulfide (PPS) – A Global Market Overview The report reviews, analyzes and projects the global market for Polyphenylene Sulfide (PPS) for the period 2012‐2022 Published: Feb 2016 Report Code: CP038 Pages: 236 Charts: 115 Price: $3960 Single User License, $5760 Enterprise License SUMMARY Polyphenylene Sulfide (PPS) is a semi‐crystalline, high performance (or high temperature) engineering plastic that possesses exceptionally high mechanical, high temperature properties and chemical resistance, rendering it to be the alternative of choice for metals and thermosets. Commercially, PPS is available in different forms and grades such as compounds, fibers, filaments, films and coatings. PPS resin is generally reinforced with various reinforcing materials, specifically glass fibers, in order to improve its mechanical and thermal properties. Such compounds primarily find application in injection molding processes. Unfilled PPS resin can be melt spun and melt blown to produce fibers and fabrics that are used for conveyor belts, flame‐ resistant clothing and filtration media. PPS resin is also made into films and coatings. the same period is likely to be recorded by industrial applications of PPS, the market for which is projected to stand at 59.7 thousand metric tons in 2022. The growth in industrial applications is mainly attributed to the Asia‐Pacific region, led by China, where PPS consumption in filter bags and coatings is expected to witness high growth during 2016‐2022 period. This global market report includes 115 charts (includes a data table and graphical representation for each chart), supported with meaningful and easy to understand graphical presentation, of the market. The statistical tables represent the data for the global market by geographic region, product type and end‐use applications of PPS. This report profiles 21 key global players and 33 major players including PPS resin manufacturers and PPS compounders across the North America – 8; Europe – 9 and Asia‐ Pacific – 16. The profiles include business overview, product portfolio, PPS resin capacities, addresses, contact numbers and the website addresses. The polyphenylene sulfide market study reviews, analyzes and projects the global market for polyphenylene sulfide for the period 2012‐2022 while discussing the global PPS resin installed capacities. Global market for polyphenylene sulfide product types analyzed in the report include PPS compounds and other PPS products such as fibers, films and coatings. Global Polyphenylene Sulfide (PPS) Market Analysis (2012‐2022) in Value (USD Million) Market for polyphenylene sulfide application areas analyzed in the study include automotive, electrical & electronics, industrial and other applications. Further, the report estimates and projects the global polyphenylene sulfide market in terms of volume in metric tons and value in USD by geographic regions covering North America, Europe, Asia‐Pacific and Rest of World. As a value addition, the report also discusses the global market for PPS on neat resin basis. Global volume consumption of PPS projected to reach 189.4 thousand metric tons, valued at US$2 billion by 2022 at a CAGR of 7.7% between 2016 and 2022. Automotive forms the largest application of PPS in terms of volume consumed, with a market share of 41.5% in 2016 and is expected to maintain a 2016‐2022 CAGR of 6.6%. However, the fastest volume CAGR of 11.2% over 2012 2017 2022 Click here to buy the report Page 1
Polyphenylene Sulfide (PPS) – A Global Market Overview Polyphenylene Sulfide (PPS) – A Global Market Overview Feb 2016 |236 Pages | 115 Charts | Price $3960 SAMPLE COMPANY PROFILE DICCORPORATION(JAPAN) DIC Building, 7‐20, Nihonbashi 3‐chome, Chuo‐ku, Tokyo 103‐8233, Japan Phone: +81‐3‐6733‐3000 Website: www.dic‐global.com SAMPLE TABLE/CHART Glance at 2017 Global Polyphenylene Sulfide (PPS) Volume Market Share (%) by End‐Use Application – Automotive, Electricals & Electronics, Industrial and Other Applications Business Overview Founded in 1908 and headquartered in Tokyo, Japan, DIC Corporation is a leading global chemical company engaged in the manufacture and supply of printing inks, organic pigments, and thermosetting resins. Other activities of the company include production of polymers, specialty plastics and compounds, and others, including building materials, pressure‐sensitive adhesives materials, and biochemicals. DIC’s operations are classified into four business segments, viz., Printing Inks, Fine Chemicals, Polymers and Application Materials. Global Polyphenylene Sulfide (PPS) Market Analysis (2012‐2022) by Geographic Region – North America, Europe, Asia‐Pacific and Rest of World in '000 Metric Tons Business Segment Analysis Business Segment Particulars Printing Inks Engaged in producing and supplying offset inks, gravure inks, flexo inks, can coatings, news inks, packaging adhesives and printing supplies Pigment products division engaged in producing and supplying organic pigments, special effect pigments, metal carboxylates and sulfur chemicals (lubricant additives) Liquid Crystal Material products division engaged in producing and supplying TFT LC materials and STN LC materials Engaged in producing and supplying acrylic resins, alkyd resins, alkylphenols, amino resins, epoxy resins, fluorochemicals, methacrylate resins, phenolic resins, plasticizers, polyester resins, polystyrene, polyurethane resins, unsaturated polyester resins, UV‐curable resins and waterborne resins Liquid Compound products division engaged in producing and supplying jet inks, fiber & textile colorings & artificial leather colorants, high‐performance coatings & adhesive materials, coatings for optical films and inks for printed electronics Solid Compound products division engaged in producing and supplying PPS compounds, high‐performance compounds, plastic colorants and high‐performance optical materials Application Material products division engaged in producing and supplying industrial adhesive tapes, hollow‐fiber membranes and modules, magnetic tape and coated sheets, coextruded multilayer films, health foods & natural colorants, decorative boards, interior housing products & coatings for building materials, decorative sheets & decorative films, processed sheet molding compounds (SMCs) & bulk molding compounds (BMCs) and molded plastic products Fine Chemicals 2012 2017 2022 KEY PLAYERS PROFILED Polymers PPS Resin Manufacturers Celanese Corporation (FORTRON) DIC Corporation Kureha Corporation SK Chemicals Co Ltd (INITZ) Solvay Specialty Polymers USA, LLC Toray Industries, Inc. Tosoh Corporation Zhejiang NHU Special Materials Co Ltd PPS Compounders and Processors A. Schulman, Inc. ALBIS Plastic GmbH Ensinger GmbH Kotec Corporation Lati Industria Termoplastici SpA Lehmann & Voss & Co Lion Idemitsu Composites Co., Ltd. Polyone Corporation Polyplastics Co Ltd Quadrant AG RTP Company SABIC Innovative Plastics Toyobo Co Ltd Application Materials …………………….more …………………….more Click here to buy the report Page 2
Polyphenylene Sulfide (PPS) – A Global Market Overview Polyphenylene Sulfide (PPS) – A Global Market Overview Feb 2016 |236 Pages | 115 Charts | Price $3960 TABLE OF CONTENTS Development of Halogen‐free Fortron® PPS CES50 for Consumer Electronics Device Housings .......................... 75 Use of Celanese's Fortron ICE PPS in Making Allied Series VX‐Mid™ HT UHF RFID Tag ............................................. 75 Commercial Release of Xtel® PPS Alloys under the Ryton® PPS Brand Name ............................................................. 76 Use of Celanese's Fortron PPS in Making Ice Protection Plates and in Aircraft Window Frame Production Process . 76 Celanese Presents New Bomat Profitherm Heat Exchanger with Fortron® PPS at K 2013 ........................................... 76 Celanese Offers Fortron® PPS for Use in Automotive Head‐ Up Displays for Safe Driving ............................................ 77 HCL Replaces Conventional PEEK Cable Ties for Oil and Gas Pipelines with Fortron® PPS ............................................ 77 Development of New Sealing Shim and Flange by KACO Using Celanese's Fortron® PPS ....................................... 77 Klopman Relies on Fortron® PPS Fibers from Celanese to Make the New Sungrazer 180 Fabric for PPE Clothing .... 78 Plans to Set up Toray's First Manufacturing Base for PPS Resin outside Japan ........................................................ 78 Albis Plastic and Toray Form Torelina® PPS Distribution Pact ..... 78 Lion Idemitsu Composites Acquires Idemitsu Kosan’s PPS Business .......................................................................... 79 Use of Celanese's Fortron® FX4382T1 PPS in Food Handling Applications ..................................................... 79 New Bi‐Component PPS Felt Media for Coal‐Fired Boilers Launched by GE .............................................................. 79 Implementation of Hot Water Systems for Molding Fortron PPS Deliver Exceptional Heat Transfer Performance ................................................................... 79 Teijin Chemicals Signs Collaborative Agreement with SK Chemicals ...................................................................... 80 Fortron Industries Celebrates 20th Anniversary with an Overall PPS Production of 230 Million Pounds................ 80 Chevron Philips Chemical Celebrates 40th Anniversary of Ryton® PPS .................................................................... 81 Construction of Toray's Third Compounding Facility in China .... 81 Chrysler Relies on Molded Plastic Transmission Accumulator Piston Made Using Ryton PPS .................... 81 DIC to Build New PPS Polymer Production Line to Expand its Overall Production Capacity ....................................... 81 Fortron Industries to Enhance PPS Production at Wilmington Plant ............................................................ 82 2.1.2.3 Can “Polimotor 2” Make the Dream of All‐ Plastic Car Engine Come True? ................................ 23 2.2 PPS Thermoplastics Usage Continue to Grow in Aerospace Industry .................................................. 24 2.2.1 Aircraft Seat Designed Using PPS ................... 25 2.2.2 Airbus Military Plane Features PPS Composite 25 2.3 Above Average Growth for PPS to be Driven by Filter Bag Industry in Asia‐Pacific ............................. 26 PART A: GLOBAL MARKET PERSPECTIVE ........ 1 1. INTRODUCTION .................................................. 1 1.1 Product Outline .................................................... 2 1.1.1 What is Polyphenylene Sulfide (PPS)? ............... 2 Figure 1: Polyphenylene Sulfide (PPS) Chemical Formula . 2 1.1.2 Properties of Polyphenylene Sulfide (PPS) ........ 3 Table 1: Performance Properties of PPS ........................... 3 Table 2: Comparison of Performance Properties of Select Commercial 40% Glass Fiber Filled PPS Grades ................ 4 Figure 2: Plastics Performance Pyramid ........................... 4 Table 3: Thermal Properties of Select High Performance Plastics ............................................................................. 5 1.1.2.1 High Temperature Resistance ........................ 5 1.1.2.2 Chemical Resistance ...................................... 6 1.1.2.3 Electrical Properties ....................................... 6 1.1.2.4 Flame Retardancy and Wear Resistance ........ 6 1.1.2.5 Machining Performance ................................. 6 1.1.3 Polyphenylene Sulfide (PPS) Product Types ...... 7 Table 4: Comparison of Storage Modulus (E’) Between Cross‐Linked and Linear PPS ............................................. 7 Figure 3: Comparison of Cross‐Linked and Linear PPS ...... 7 1.1.3.1 PPS Compounds ............................................. 8 1.1.3.2 PPS Fibers and Filaments ............................... 9 1.1.3.3 PPS Films ........................................................ 9 1.1.3.4 PPS Coatings .................................................. 9 1.2 End‐use Application Analysis ............................. 10 Chart 1: Global Polyphenylene Sulfide (PPS) Market Overview (2012, 2016 & 2020) by End‐Use Application in '000 Metric Tons..............................................................10 1.2.1 Automotive Applications ................................ 11 Chart 2: Global Market for Polyphenylene Sulfide (PPS) in Automotive Applications (2012, 2016 & 2020) by Geographic Region in '000 Metric Tons ...........................12 1.2.2 Electrical/Electronic Applications .................... 13 Chart 3: Global Market for Polyphenylene Sulfide (PPS) in Electrical & Electronic Applications (2012, 2016 & 2020) by Geographic Region in '000 Metric Tons ...........................14 1.2.3 Industrial/Consumer Applications .................. 15 Chart 4: Global Market for Polyphenylene Sulfide (PPS) in Industrial Applications (2012, 2016 & 2020) by Geographic Region in '000 Metric Tons ..............................................17 1.2.4 Other Applications .......................................... 18 Chart 5: Global Market for Polyphenylene Sulfide (PPS) in Other Applications (2012, 2016 & 2020) by Geographic Region in '000 Metric Tons .............................................18 3. INDUSTRY LANDSCAPE ...................................... 29 3.1 Commercial Production Technologies for PPS ... 29 3.2 History of Polyphenylene Sulfide (PPS) Industry ... 32 Table 9: History of PPS Industry – 1973‐2000 ................. 33 Table 10: History of PPS Industry – 2001‐2015 ................ 34 3.3 Global PPS Production Capacities ...................... 36 Chart 6: Global Polyphenylene Sulfide (PPS) Installed Capacities by Country in Metric Tons .............................. 36 Chart 7: Global Polyphenylene Sulfide (PPS) Installed Capacities by Manufacturer and Country in Metric Tons 37 4. KEY GLOBAL PLAYERS ........................................ 39 PPS Resin Manufacturers ...................................... 39 Celanese Corporation (Fortron) (United States) .............. 39 Fortron Industries Llc (United States) .............................. 40 Dic Corporation (Japan) .................................................. 42 Kureha Corporation (Japan) ............................................ 45 Sk Chemicals Co Ltd (INITZ) (South Korea) ...................... 47 Solvay Specialty Polymers Usa, Llc (United States) .......... 48 Toray Industries, Inc. (Japan) .......................................... 50 Tosoh Corporation (Japan) .............................................. 52 Zhejiang Nhu Special Materials Co Ltd (China) ................ 53 PPS Compounders and Processors......................... 54 A. Schulman, Inc. (United States) .................................... 54 Albis Plastic GmbH (Germany) ........................................ 55 Ensinger GmbH (Germany) ............................................. 57 Kotec Corporation (Japan) .............................................. 59 Lati Industria Termoplastici SpA (Italy) ............................ 60 Lehmann & Voss & Co (Germany) ................................... 61 Lion Idemitsu Composites Co., Ltd. (Japan) ..................... 61 Polyone Corporation (United States) .............................. 62 Polyplastics Co Ltd (Japan) .............................................. 63 Quadrant AG (Switzerland) ............................................. 64 Rtp Company (United States) .......................................... 65 Sabic Innovative Plastics (United States) ......................... 69 Toyobo Co Ltd (Japan) ..................................................... 70 6. GLOBAL MARKET OVERVIEW ............................. 83 Chart 8: Global Polyphenylene Sulfide (PPS) Market Analysis (2012‐2022) in Volume ('000 Metric Tons) and Value (USD Million) ........................................................ 83 6.1 Market Overview by Product Type .................... 84 Chart 9: Global Polyphenylene Sulfide (PPS) Market Analysis (2012‐2022) by Product Type – PPS Compounds and Other PPS in '000 Metric Tons ................................. 84 Chart 10: Glance at 2012, 2017 and 2022 Global Polyphenylene Sulfide (PPS) Volume Market Share (%) by Type – PPS Compounds and Other PPS ........................... 85 6.1.1 Product Type Market Overview by Geographic Region ...................................................................... 86 6.1.1.1 PPS Compounds ........................................... 86 Chart 11: Global Polyphenylene Sulfide (PPS) Compounds Market Analysis (2012‐2022) by Geographic Region – North America, Europe, Asia‐Pacific and Rest of World in '000 Metric Tons ............................................................. 86 Chart 12: Glance at 2012, 2017 and 2022 Global Polyphenylene Sulfide (PPS) Compounds Volume Market Share (%) by Geographic Region – North America, Europe, Asia‐Pacific and Rest of World ........................................ 87 6.1.1.2 Other PPS Products ...................................... 88 Chart 13: Global Other Polyphenylene Sulfide (PPS) Products Market Analysis (2012‐2022) by Geographic Region – North America, Europe, Asia‐Pacific and Rest of World in '000 Metric Tons .............................................. 88 Chart 14: Glance at 2012, 2017 and 2022 Global Polyphenylene Sulfide (PPS) Product Type Volume Market Share (%) by Geographic Region – North America, Europe, Asia‐Pacific and Rest of World ........................................ 89 5. KEY BUSINESS AND PRODUCT TRENDS .............. 71 Industry’s first PPS resin particles for powder bed fusion 3D printing developed by Toray ...................................... 71 Production Capacity of Polyplastics' Facility in Malaysia Increased by 9,000 Tons ................................................. 71 Polyphenylene Sulfide Fiber TORCON™ and Polyacrylonitrile‐base Flame Resistant Yarn Utilized to Develop High Performance Flame Shielding Paper ......... 71 Launch of Celanese® PPS Grades in Japan ...................... 72 Strategic Alliance with NHU Reinforces the High Performance Engineering Plastics Portfolio of DSM ........ 72 Development of the Polimotor 2 All‐Plastic Automotive Engine by Solvay ............................................................. 72 SK Chemicals and INITZ to Exhibit Super Engineering Plastics at Chinaplas 2015 ............................................... 73 Construction of New Production Line to Broaden DIC's PPS Polymer Production Capacity .......................................... 73 Ryton® PPS Acquired by Solvay ....................................... 73 First Supply Deal of SK Chemicals with a Major International Company for Super Engineering Plastic Materials ........................................................................ 74 Launch of Two Novel Grades of Ryton® PPS for Food Contact Applications ....................................................... 74 Establishment of DIC Corporation's First PPS Compounds Facility in the PRC............................................................ 74 Broadening of Celanese's Kentucky Compounding Production Facility .......................................................... 75 Celanese to Expand Compounding Capabilities at Nanjing Integrated Chemical Complex ......................................... 75 2. KEY MARKET TRENDS ........................................ 19 2.1 Auto Industry Acts as Bedrock for Propelling PPS Demand ................................................................... 19 2.1.1 Global Hybrid and Electric Vehicle Market...... 20 Table 5: Global Hybrid and Electric Vehicle Sales (2011‐ 2015) by Region – Asia‐Pacific, Europe, North America and Rest of World in Units .....................................................20 2.1.1.1 Battery Electric Vehicles .............................. 20 Table 6: Global Battery Electric Vehicle (BEV) Sales (2011‐ 2015) by Region – Asia‐Pacific, Europe, North America and Rest of World ..................................................................20 2.1.1.2 Plug‐in Hybrid Electric Vehicles .................... 21 Table 7: Global Plug‐in Hybrid Electric Vehicle (PHEV) Sales (2011‐2015) by Region – Asia‐Pacific, Europe, North America and Rest of World ..............................................21 2.1.1.3 Hybrid Electric Vehicles ................................ 21 Table 8: Global Hybrid Electric Vehicle (HEV) Sales (2011‐ 2015) by Region – Asia‐Pacific, Europe, North America and Rest of World ..................................................................21 2.1.2 Recent Developments in the Usage of PPS Resin in Automotive Industry ............................................ 22 2.1.2.1 PPS in Auto Head‐Up Display ....................... 22 2.1.2.2 Tubular Cooling System’s Weight Lowered with PPS Use ............................................................ 22 Click here to buy the report Page 3
Polyphenylene Sulfide (PPS) – A Global Market Overview Polyphenylene Sulfide (PPS) – A Global Market Overview Feb 2016 |236 Pages | 115 Charts | Price $3960 6.2.1.4 Other End‐Use Applications ....................... 106 Volume Analysis..................................................... 106 Chart 31: Global Market for Polyphenylene Sulfide (PPS) in Other End‐Use Applications (2012‐2022) by Geographic Region – North America, Europe, Asia‐Pacific and Rest of World in '000 Metric Tons ............................................. 106 Chart 32: Glance at 2012, 2017 and 2022 Global Volume Market Share (%) of Polyphenylene Sulfide (PPS) in Other End‐Use Applications by Geographic Region – North America, Europe, Asia‐Pacific and Rest of World .......... 107 Value Analysis ........................................................ 108 Chart 33: Global Market for Polyphenylene Sulfide (PPS) in Other End‐Use Applications (2012‐2022) by Geographic Region – North America, Europe, Asia‐Pacific and Rest of World in USD Million ..................................................... 108 Chart 34: Glance at 2012, 2017 and 2022 Global Value Market Share (%) of Polyphenylene Sulfide (PPS) in Other End‐Use Applications by Geographic Region – North America, Europe, Asia‐Pacific and Rest of World .......... 109 6.3 Global Polyphenylene Sulfide (PPS) Consumption on Neat Resin Basis ................................................ 110 Chart 35: Global Polyphenylene Sulfide (PPS) Volume Consumption (2012‐2022) on Neat Resin Basis in '000 Metric Tons ................................................................... 110 6.3.1 Global Polyphenylene Sulfide (PPS) Consumption by Product Type on Neat Resin Basis111 Chart 36: Global Polyphenylene Sulfide (PPS) Volume Consumption (2012‐2022) on Neat Resin Basis by Product Type – PPS Compounds and Other PPS in '000 Metric Tons ................ 111 Chart 37: Glance at 2012, 2017 and 2022 Global Polyphenylene Sulfide (PPS) Volume Consumption Share (%) on Neat Resin Basis by Product Type – PPS Compounds and Other PPS ............................................................... 112 6.3.2 Global Polyphenylene Sulfide (PPS) Consumption by Geographic Region on Neat Resin Basis ............... 113 Chart 38: Global Polyphenylene Sulfide (PPS) Volume Consumption (2012‐2022) on Neat Resin Basis by Geographic Region – North America, Europe, Asia‐Pacific and Rest of World in '000 Metric Tons .......................... 113 Chart 39: Glance at 2012, 2017 and 2022 Global Polyphenylene Sulfide (PPS) Volume Consumption Share (%) on Neat Resin Basis by Geographic Region – North America, Europe, Asia‐Pacific and Rest of World .......... 114 6.3.2.1 Global Regional Polyphenylene Sulfide (PPS) Consumption by Product Type on Neat Resin Basis ...115 6.3.2.1.1 North America ........................................ 115 Chart 40: North American Polyphenylene Sulfide (PPS) Volume Consumption (2012‐2022) on Neat Resin Basis by Product Type – PPS Compounds and Other PPS in '000 Metric Tons ................................................................... 115 Chart 41: Glance at 2012, 2017 and 2022 North American Polyphenylene Sulfide (PPS) Volume Consumption Share (%) on Neat Resin Basis by Product Type – PPS Compounds and Other PPS ............................................................... 116 6.3.2.1.2 Europe .................................................... 117 Chart 42: European Polyphenylene Sulfide (PPS) Volume Consumption (2012‐2022) on Neat Resin Basis by Product Type – PPS Compounds and Other PPS in '000 Metric Tons ................ 117 Chart 43: Glance at 2012, 2017 and 2022 European Polyphenylene Sulfide (PPS) Volume Consumption Share (%) on Neat Resin Basis by Product Type – PPS Compounds and Other PPS ............................................................... 118 6.3.2.1.3 Asia‐Pacific .............................................. 119 Chart 44: Asia‐Pacific Polyphenylene Sulfide (PPS) Volume Consumption (2012‐2022) on Neat Resin Basis by Product Type – PPS Compounds and Other PPS in '000 Metric Tons ................ 119 Chart 45: Glance at 2012, 2017 and 2022 Asia‐Pacific Polyphenylene Sulfide (PPS) Volume Consumption Share (%) on Neat Resin Basis by Product Type – PPS Compounds and Other PPS ............................................................... 120 6.3.2.1.4 Rest of World .......................................... 121 Chart 46: Rest of World Polyphenylene Sulfide (PPS) Volume Consumption (2012‐2022) on Neat Resin Basis by Product Type – PPS Compounds and Other PPS in '000 Metric Tons ................ 121 Chart 47: Glance at 2012, 2017 and 2022 Rest of World Polyphenylene Sulfide (PPS) Volume Consumption Share (%) on Neat Resin Basis by Product Type – PPS Compounds and Other PPS ............................................................... 122 6.2 Market Overview by End‐Use Application ......... 90 Volume Analysis ....................................................... 90 Chart 15: Global Polyphenylene Sulfide (PPS) Market Analysis (2012‐2022) by End‐Use Application – Automotive, Electricals & Electronics, Industrial and Other Applications in '000 Metric Tons .....................................90 Chart 16: Glance at 2012, 2017 and 2022 Global Polyphenylene Sulfide (PPS) Volume Market Share (%) by End‐Use Application – Automotive, Electricals & Electronics, Industrial and Other Applications .................91 Value Analysis .......................................................... 92 Chart 17: Global Polyphenylene Sulfide (PPS) Market Analysis (2012‐2022) by End‐Use Application – Automotive, Electricals & Electronics, Industrial and Other Applications in USD Million .............................................92 Chart 18: Glance at 2012, 2017 and 2022 Global Polyphenylene Sulfide (PPS) Value Market Share (%) by End‐Use Application – Automotive, Electricals & Electronics, Industrial and Other Applications .................93 6.2.1 End‐Use Application Market Overview by Geographic Region................................................... 94 6.2.1.1 Automotive Applications ............................. 94 Volume Analysis ....................................................... 94 Chart 19: Global Market for Polyphenylene Sulfide (PPS) in Automotive Applications (2012‐2022) by Geographic Region – North America, Europe, Asia‐Pacific and Rest of World in '000 Metric Tons ...............................................94 Chart 20: Glance at 2012, 2017 and 2022 Global Volume Market Share (%) of Polyphenylene Sulfide (PPS) in Automotive Applications by Geographic Region – North America, Europe, Asia‐Pacific and Rest of World .............95 Value Analysis .......................................................... 96 Chart 21: Global Market for Polyphenylene Sulfide (PPS) in Automotive Applications (2012‐2022) by Geographic Region – North America, Europe, Asia‐Pacific and Rest of World in USD Million .......................................................96 Chart 22: Glance at 2012, 2017 and 2022 Global Value Market Share (%) of Polyphenylene Sulfide (PPS) in Automotive Applications by Geographic Region – North America, Europe, Asia‐Pacific and Rest of World .............97 6.2.1.2 Electrical & Electronic Applications .............. 98 Volume Analysis ....................................................... 98 Chart 23: Global Market for Polyphenylene Sulfide (PPS) in Electrical & Electronic Applications (2012‐2022) by Geographic Region – North America, Europe, Asia‐Pacific and Rest of World in '000 Metric Tons ............................98 Chart 24: Glance at 2012, 2017 and 2022 Global Volume Market Share (%) of Polyphenylene Sulfide (PPS) in Electrical & Electronic Applications by Geographic Region – North America, Europe, Asia‐Pacific and Rest of World 99 Value Analysis ........................................................ 100 Chart 25: Global Market for Polyphenylene Sulfide (PPS) in Electrical & Electronic Applications (2012‐2022) by Geographic Region – North America, Europe, Asia‐Pacific and Rest of World in USD Million .................................. 100 Chart 26: Glance at 2012, 2017 and 2022 Global Value Market Share (%) of Polyphenylene Sulfide (PPS) in Electrical & Electronic Applications by Geographic Region – North America, Europe, Asia‐Pacific and Rest of World .............. 101 6.2.1.3 Industrial Applications ............................... 102 Volume Analysis ..................................................... 102 Chart 27: Global Market for Polyphenylene Sulfide (PPS) in Industrial Applications (2012‐2022) by Geographic Region – North America, Europe, Asia‐Pacific and Rest of World in '000 Metric Tons............................................................ 102 Chart 28: Glance at 2012, 2017 and 2022 Global Volume Market Share (%) of Polyphenylene Sulfide (PPS) in Industrial Applications by Geographic Region – North America, Europe, Asia‐Pacific and Rest of World ........... 103 Value Analysis ........................................................ 104 Chart 29: Global Market for Polyphenylene Sulfide (PPS) in Industrial Applications (2012‐2022) by Geographic Region – North America, Europe, Asia‐Pacific and Rest of World in USD Million ................................................................... 104 Chart 30: Glance at 2012, 2017 and 2022 Global Value Market Share (%) of Polyphenylene Sulfide (PPS) in Industrial Applications by Geographic Region – North America, Europe, Asia‐Pacific and Rest of World ........... 105 PART B: REGIONAL MARKET PERSPECTIVE .. 123 Volume Analysis .................................................... 123 Chart 48: Global Polyphenylene Sulfide (PPS) Market Analysis (2012‐2022) by Geographic Region – North America, Europe, Asia‐Pacific and Rest of World in '000 Metric Tons .................................................................. 123 Chart 49: Glance at 2012, 2017 and 2022 Global Polyphenylene Sulfide (PPS) Volume Market Share (%) by Geographic Region – North America, Europe, Asia‐Pacific and Rest of World ......................................................... 124 Value Analysis ........................................................ 125 Chart 50: Global Polyphenylene Sulfide (PPS) Market Analysis (2012‐2022) by Geographic Region – North America, Europe, Asia‐Pacific and Rest of World in USD Million .......................................................................... 125 Chart 51: Glance at 2012, 2017 and 2022 Global Polyphenylene Sulfide (PPS) Value Market Share (%) by Geographic Region – North America, Europe, Asia‐Pacific and Rest of World ......................................................... 126 REGIONAL MARKET OVERVIEW ........................... 127 1. NORTH AMERICA ............................................ 127 Chart 52: North American Polyphenylene Sulfide (PPS) Market Analysis (2012‐2022) in Volume ('000 Metric Tons) and Value (USD Million) ................................................ 127 1.1 North American Market Overview by Product Type ....................................................................... 128 Chart 53: North American Polyphenylene Sulfide (PPS) Market Analysis (2012‐2022) by Product Type – PPS Compounds and Other PPS in '000 Metric Tons ........... 128 Chart 54: Glance at 2012, 2017 and 2022 North American Polyphenylene Sulfide (PPS) Volume Market Share (%) by Type – PPS Compounds and Other PPS ......................... 129 1.2 North American Market Overview by Region .. 130 Value Analysis ........................................................ 130 Chart 55: North American Polyphenylene Sulfide (PPS) Market Analysis (2012‐2022) by Region – United States and Rest of North America in '000 Metric Tons ............ 130 Chart 56: Glance at 2012, 2017 and 2022 North American Polyphenylene Sulfide (PPS) Volume Market Share (%) by Region – United States and Rest of North America ....... 131 Value Analysis ........................................................ 132 Chart 57: North American Polyphenylene Sulfide (PPS) Market Analysis (2012‐2022) by Region – United States and Rest of North America in USD Million .................... 132 Chart 58: Glance at 2012, 2017 and 2022 North American Polyphenylene Sulfide (PPS) Value Market Share (%) by Region – United States and Rest of North America ....... 133 1.3 North American Market Overview by End‐use Application ............................................................ 134 Volume Analysis .................................................... 134 Chart 59: North American Polyphenylene Sulfide (PPS) Market Analysis (2012‐2022) by End‐use Application – Automotive, Electricals & Electronics, Industrial and Other Applications in '000 Metric Tons ................................... 134 Chart 60: Glance at 2012, 2017 and 2022 North American Polyphenylene Sulfide (PPS) Volume Market Share (%) by End‐use Application – Automotive, Electricals & Electronics, Industrial and Other Applications .............. 135 Value Analysis ........................................................ 136 Chart 61: North American Polyphenylene Sulfide (PPS) Market Analysis (2012‐2022) by End‐use Application – Automotive, Electricals & Electronics, Industrial and Other Applications in USD Million .......................................... 136 Chart 62: Glance at 2012, 2017 and 2022 North American Polyphenylene Sulfide (PPS) Value Market Share (%) by End‐use Application – Automotive, Electricals & Electronics, Industrial and Other Applications .............. 137 1.4 Major Market Players ...................................... 138 A. Schulman, Inc. (United States) .................................. 138 Celanese Corporation (Fortron) (United States) ........... 139 Gehr Plastics Inc (United States) ................................... 142 Polyone Corporation (United States) ............................ 143 RTP Company (United States) ....................................... 144 Sabic Innovative Plastics (United States) ...................... 145 Solvay Specialty Polymers USA, LLC (United States) ..... 146 Techmer Engineered Solutions (United States) ............ 148 Click here to buy the report Page 4
Polyphenylene Sulfide (PPS) – A Global Market Overview Polyphenylene Sulfide (PPS) – A Global Market Overview Feb 2016 |236 Pages | 115 Charts | Price $3960 Chart 79: Glance at 2012, 2017 and 2022 European Polyphenylene Sulfide (PPS) Volume Market Share (%) by End‐use Application – Automotive, Electricals & Electronics, Industrial and Other Applications .............. 165 Value Analysis ........................................................ 166 Chart 80: European Polyphenylene Sulfide (PPS) Market Analysis (2012‐2022) by End‐use Application – Automotive, Electricals & Electronics, Industrial and Other Applications in USD Million ........................................... 166 Chart 81: Glance at 2012, 2017 and 2022 European Polyphenylene Sulfide (PPS) Value Market Share (%) by End‐use Application – Automotive, Electricals & Electronics, Industrial and Other Applications .............. 167 2.4 Major Market Players ...................................... 168 Albis Plastic GmbH (Germany) ...................................... 168 Centroplast Engineering Plastics GmbH (Germany) ...... 170 Ensinger GmbH (Germany) ........................................... 171 Eurostar Engineering Plastics (France) .......................... 173 Grupo Repol (Spain) ...................................................... 173 LATI Industria Termoplastici SPA (Italy) ......................... 174 Lehmann & Voss & Co (Germany) ................................. 175 Murtfeldt Kunststoffe GmbH & Co KG (Germany) ......... 175 Quadrant AG (Switzerland) ........................................... 176 Haohua Honghe Chemical Co Ltd (China) ..................... 194 Kotec Corporation (Japan) ............................................ 195 Kureha Corporation (Japan) .......................................... 196 LG Chem (South Korea) ................................................ 198 Lion Idemitsu Composites Co., Ltd. (Japan) .................. 199 Polyplastics Co Ltd (Japan) ............................................ 200 Samsung SDI Co Ltd (South Korea) ............................... 201 SK Chemicals Co Ltd (INITZ) (South Korea) .................... 202 Toray Industries, Inc. (Japan) ........................................ 203 Tosoh Corporation (Japan) ........................................... 205 Toyobo Co Ltd (Japan) .................................................. 206 Zhejiang NHU Special Materials Co Ltd (China) ............. 207 3.5 Asia‐Pacific Market Overview by Country ........ 208 3.5.1 China .......................................................... 208 Volume Analysis .................................................... 208 Chart 93: Chinese Polyphenylene Sulfide (PPS) Market Analysis (2012‐2022) by End‐use Application – Automotive, Electricals & Electronics, Industrial and Other Applications in '000 Metric Tons ................................... 208 Chart 94: Glance at 2012, 2017 and 2022 Chinese Polyphenylene Sulfide (PPS) Volume Market Share (%) by End‐use Application – Automotive, Electricals & Electronics, Industrial and Other Applications .............. 209 Value Analysis ........................................................ 210 Chart 95: Chinese Polyphenylene Sulfide (PPS) Market Analysis (2012‐2022) by End‐use Application – Automotive, Electricals & Electronics, Industrial and Other Applications in USD Million .......................................... 210 Chart 96: Glance at 2012, 2017 and 2022 Chinese Polyphenylene Sulfide (PPS) Value Market Share (%) by End‐use Application – Automotive, Electricals & Electronics, Industrial and Other Applications .............. 211 3.5.2 Japan ......................................................... 212 Volume Analysis .................................................... 212 Chart 97: Japanese Polyphenylene Sulfide (PPS) Market Analysis (2012‐2022) by End‐use Application – Automotive, Electricals & Electronics, Industrial and Other Applications in '000 Metric Tons ................................... 212 Chart 98: Glance at 2012, 2017 and 2022 Japanese Polyphenylene Sulfide (PPS) Volume Market Share (%) by End‐use Application – Automotive, Electricals & Electronics, Industrial and Other Applications .............. 213 Value Analysis ........................................................ 214 Chart 99: Japanese Polyphenylene Sulfide (PPS) Market Analysis (2012‐2022) by End‐use Application – Automotive, Electricals & Electronics, Industrial and Other Applications in USD Million .......................................... 214 Chart 100: Glance at 2012, 2017 and 2022 Japanese Polyphenylene Sulfide (PPS) Value Market Share (%) by End‐use Application – Automotive, Electricals & Electronics, Industrial and Other Applications .............. 215 3.5.3 South Korea ............................................... 216 Volume Analysis .................................................... 216 Chart 101: South Korean Polyphenylene Sulfide (PPS) Market Analysis (2012‐2022) by End‐use Application – Automotive, Electricals & Electronics, Industrial and Other Applications in '000 Metric Tons ................................... 216 Chart 102: Glance at 2012, 2017 and 2022 South Korean Polyphenylene Sulfide (PPS) Volume Market Share (%) by End‐use Application – Automotive, Electricals & Electronics, Industrial and Other Applications .............. 217 Value Analysis ........................................................ 218 Chart 103: South Korean Polyphenylene Sulfide (PPS) Market Analysis (2012‐2022) by End‐use Application – Automotive, Electricals & Electronics, Industrial and Other Applications in USD Million .......................................... 218 Chart 104: Glance at 2012, 2017 and 2022 South Korean Polyphenylene Sulfide (PPS) Value Market Share (%) by End‐use Application – Automotive, Electricals & Electronics, Industrial and Other Applications .............. 219 3.5.4 Rest of Asia‐Pacific ..................................... 220 Volume Analysis .................................................... 220 Chart 105: Rest of Asia‐Pacific Polyphenylene Sulfide (PPS) Market Analysis (2012‐2022) by End‐use Application – Automotive, Electricals & Electronics, Industrial and Other Applications in '000 Metric Tons ................................... 220 1.5 North American Market Overview by Country ... 149 1.5.1 The United States ....................................... 149 Volume Analysis ..................................................... 149 Chart 63: United States Polyphenylene Sulfide (PPS) Market Analysis (2012‐2022) by End‐use Application – Automotive, Electricals & Electronics, Industrial and Other Applications in '000 Metric Tons ................................... 149 Chart 64: Glance at 2012, 2017 and 2022 United States Polyphenylene Sulfide (PPS) Volume Market Share (%) by End‐use Application – Automotive, Electricals & Electronics, Industrial and Other Applications ............... 150 Value Analysis ........................................................ 151 Chart 65: United States Polyphenylene Sulfide (PPS) Market Analysis (2012‐2022) by End‐use Application – Automotive, Electricals & Electronics, Industrial and Other Applications in USD Million ........................................... 151 Chart 66: Glance at 2012, 2017 and 2022 United States Polyphenylene Sulfide (PPS) Value Market Share (%) by End‐use Application – Automotive, Electricals & Electronics, Industrial and Other Applications ............... 152 1.5.2 Rest of North America ................................ 153 Volume Analysis ..................................................... 153 Chart 67: Rest of North America Polyphenylene Sulfide (PPS) Market Analysis (2012‐2022) by End‐use Application – Automotive, Electricals & Electronics, Industrial and Other Applications in '000 Metric Tons ......................... 153 Chart 68: Glance at 2012, 2017 and 2022 Rest of North America Polyphenylene Sulfide (PPS) Volume Market Share (%) by End‐use Application – Automotive, Electricals & Electronics, Industrial and Other Applications ........... 154 Value Analysis ........................................................ 155 Chart 69: Rest of North America Polyphenylene Sulfide (PPS) Market Analysis (2012‐2022) by End‐use Application – Automotive, Electricals & Electronics, Industrial and Other Applications in USD Million ................................. 155 Chart 70: Glance at 2012, 2017 and 2022 Rest of North America Polyphenylene Sulfide (PPS) Value Market Share (%) by End‐use Application – Automotive, Electricals & Electronics, Industrial and Other Applications ............... 156 3. ASIA‐PACIFIC ................................................... 177 Chart 82: Asia‐Pacific Polyphenylene Sulfide (PPS) Market Analysis (2012‐2022) in Volume ('000 Metric Tons) and Value (USD Million) ....................................................... 177 3.1 Asia‐Pacific Market Overview by Product Type .. 178 Chart 83: Asia‐Pacific Polyphenylene Sulfide (PPS) Market Analysis (2012‐2022) by Product Type – PPS Compounds and Other PPS in '000 Metric Tons ................................ 178 Chart 84: Glance at 2012, 2017 and 2022 Asia‐Pacific Polyphenylene Sulfide (PPS) Volume Market Share (%) by Type – PPS Compounds and Other PPS ......................... 179 3.2 Asia‐Pacific Market Overview by Region .......... 180 Volume Analysis..................................................... 180 Chart 85: Asia‐Pacific Polyphenylene Sulfide (PPS) Market Analysis (2012‐2022) by Region – China, Japan, South Korea and Rest of Asia‐Pacific in '000 Metric Tons ........ 180 Chart 86: Glance at 2012, 2017 and 2022 Asia‐Pacific Polyphenylene Sulfide (PPS) Volume Market Share (%) by Region – China, Japan, South Korea and Rest of Asia‐ Pacific ........................................................................... 181 Value Analysis ........................................................ 182 Chart 87: Asia‐Pacific Polyphenylene Sulfide (PPS) Market Analysis (2012‐2022) by Region – China, Japan, South Korea and Rest of Asia‐Pacific in USD Million ................ 182 Chart 88: Glance at 2012, 2017 and 2022 Asia‐Pacific Polyphenylene Sulfide (PPS) Value Market Share (%) by Region – China, Japan, South Korea and Rest of Asia‐ Pacific ........................................................................... 183 3.3 Asia‐Pacific Market Overview by End‐use Application............................................................. 184 Volume Analysis..................................................... 184 Chart 89: Asia‐Pacific Polyphenylene Sulfide (PPS) Market Analysis (2012‐2022) by End‐use Application – Automotive, Electricals & Electronics, Industrial and Other Applications in '000 Metric Tons ................................... 184 Chart 90: Glance at 2012, 2017 and 2022 Asia‐Pacific Polyphenylene Sulfide (PPS) Volume Market Share (%) by End‐use Application – Automotive, Electricals & Electronics, Industrial and Other Applications .............. 185 Value Analysis ........................................................ 186 Chart 91: Asia‐Pacific Polyphenylene Sulfide (PPS) Market Analysis (2012‐2022) by End‐use Application – Automotive, Electricals & Electronics, Industrial and Other Applications in USD Million ........................................... 186 Chart 92: Glance at 2012, 2017 and 2022 Asia‐Pacific Polyphenylene Sulfide (PPS) Value Market Share (%) by End‐use Application – Automotive, Electricals & Electronics, Industrial and Other Applications .............. 187 3.4 Major Market Players ...................................... 188 Chengdu Letian Plastics Co Ltd (China) ......................... 188 China Lumena New Materials Corp (China) .................. 189 DIC Corporation (Japan) ................................................ 191 Dunhuang Western Region Special New Material Co Ltd (China) .......................................................................... 194 2. EUROPE .......................................................... 157 Chart 71: European Polyphenylene Sulfide (PPS) Market Analysis (2012‐2022) in Volume ('000 Metric Tons) and Value (USD Million) ....................................................... 157 2.1 European Market Overview by Product Type .. 158 Chart 72: European Polyphenylene Sulfide (PPS) Market Analysis (2012‐2022) by Product Type – PPS Compounds and Other PPS in '000 Metric Tons ................................ 158 Chart 73: Glance at 2012, 2017 and 2022 European Polyphenylene Sulfide (PPS) Volume Market Share (%) by Type – PPS Compounds and Other PPS ......................... 159 2.2 European Market Overview by Region ............ 160 Volume Analysis ..................................................... 160 Chart 74: European Polyphenylene Sulfide (PPS) Market Analysis (2012‐2022) by Region – France, Germany, Italy, Spain, United Kingdom and Rest of Europe in '000 Metric Tons............................................................................... 160 Chart 75: Glance at 2012, 2017 and 2022 European Polyphenylene Sulfide (PPS) Volume Market Share (%) by Region – France, Germany, Italy, Spain, United Kingdom and Rest of Europe ........................................................ 161 Value Analysis ........................................................ 162 Chart 76: European Polyphenylene Sulfide (PPS) Market Analysis (2012‐2022) by Region – France, Germany, Italy, Spain, United Kingdom and Rest of Europe in USD Million .. 162 Chart 77: Glance at 2012, 2017 and 2022 European Polyphenylene Sulfide (PPS) Value Market Share (%) by Region – France, Germany, Italy, Spain, United Kingdom and Rest of Europe ........................................................ 163 2.3 European Market Overview by End‐use Application ............................................................. 164 Volume Analysis ..................................................... 164 Chart 78: European Polyphenylene Sulfide (PPS) Market Analysis (2012‐2022) by End‐use Application – Automotive, Electricals & Electronics, Industrial and Other Applications in '000 Metric Tons ................................... 164 Click here to buy the report Page 5
Polyphenylene Sulfide (PPS) – A Global Market Overview Polyphenylene Sulfide (PPS) – A Global Market Overview Feb 2016 |236 Pages | 115 Charts | Price $3960 Chart 106: Glance at 2012, 2017 and 2022 Rest of Asia‐ Pacific Polyphenylene Sulfide (PPS) Volume Market Share (%) by End‐use Application – Automotive, Electricals & Electronics, Industrial and Other Applications ............... 221 Value Analysis ........................................................ 222 Chart 107: Rest of Asia‐Pacific Polyphenylene Sulfide (PPS) Market Analysis (2012‐2022) by End‐use Application – Automotive, Electricals & Electronics, Industrial and Other Applications in USD Million ........................................... 222 Chart 108: Glance at 2012, 2017 and 2022 Rest of Asia‐ Pacific Polyphenylene Sulfide (PPS) Value Market Share (%) by End‐use Application – Automotive, Electricals & Electronics, Industrial and Other Applications ............... 223 4.1 Rest of World Market Overview by Product Type ...225 Chart 110: Rest of World Polyphenylene Sulfide (PPS) Market Analysis (2012‐2022) by Product Type – PPS Compounds and Other PPS in '000 Metric Tons ............ 225 Chart 111: Glance at 2012, 2017 and 2022 Rest of World Polyphenylene Sulfide (PPS) Volume Market Share (%) by Type – PPS Compounds and Other PPS ......................... 226 4.2 Rest of World Market Overview by End‐use Application............................................................. 227 Volume Analysis..................................................... 227 Chart 112: Rest of World Polyphenylene Sulfide (PPS) Market Analysis (2012‐2022) by End‐use Application – Automotive, Electricals & Electronics, Industrial and Other Applications in '000 Metric Tons ................................... 227 Chart 113: Glance at 2012, 2017 and 2022 Rest of World Polyphenylene Sulfide (PPS) Volume Market Share (%) by End‐use Application – Automotive, Electricals & Electronics, Industrial and Other Applications .............. 228 Value Analysis ........................................................ 229 Chart 114: Rest of World Polyphenylene Sulfide (PPS) Market Analysis (2012‐2022) by End‐use Application – Automotive, Electricals & Electronics, Industrial and Other Applications in USD Million .......................................... 229 Chart 115: Glance at 2012, 2017 and 2022 Rest of World Polyphenylene Sulfide (PPS) Value Market Share (%) by End‐use Application – Automotive, Electricals & Electronics, Industrial and Other Applications .............. 230 PART C: GUIDE TO THE INDUSTRY ............... 231 1. NORTH AMERICA ............................................ 231 2. EUROPE .......................................................... 231 3. ASIA‐PACIFIC ................................................... 233 4. REST OF WORLD ............................................. 224 Chart 109: Rest of World Polyphenylene Sulfide (PPS) Market Analysis (2012‐2022) in Volume ('000 Metric Tons) and Value (USD Million) ................................................ 224 PART D: ANNEXURE .................................... 235 1. RESEARCH METHODOLOGY ............................. 235 2. FEEDBACK ....................................................... 237 INDUSTRY EXPERTS 1‐7‐19/C, Street No. 8, Habsiguda Hyderabad – 500007, India Phone: +91‐40‐4018‐1314 Fax: +91‐40‐4027‐2381 info@industry‐experts.com industry‐experts.com About Industry Experts Industry Experts values the most updated and accurate market research and industry analysis to provide unique market research reports for a broad range of industry verticals including Automotive, Transportation, Healthcare, Pharmaceuticals, Food & Beverages, Chemicals, Plastics, Materials, Consumer Goods, Retail, Biotechnology, Construction, Manufacturing and Other industries. Our research reports help our clients to identify and resolve topical issues by providing a complete picture of the market in their respective industry sectors. The Company’s rich collection of market research reports enable the companies to explore market drivers; forecast the future market; and to formulate the right strategies at the right time. Industry Experts’ leading edge publications makes the life easy for corporate strategists, investors, analysts and researchers, start‐ ups, consultants, financial and banking executives, academicians and many more. The company also provides customized research reports to cater the needs of the industry. More about Industry Experts Click here to buy the report Page 6