Download
1 / 9
90 likes | 160 Views
The recent years have been witnessing increasing demand for High Purity Alumina, more so in areas that are anticipated to exhibit high rates of growth, such as display materials, energy, automobiles, computers and semiconductors. High purity alumina, with purity equal to or greater than 99.99% and uniform fine particles, finds extensive application in translucent tubes for high-pressure sodium lamps, single crystal materials such as sapphires for watch covers, high-strength ceramic tools and abrasives for magnetic tape, among others. Properties, such as low-friction and high wear-resistance, thermal and electrical insulating ability and broad chemical compatibility make High Purity Alumina a more than useful option in military and aerospace-based applications, engine components, heat shields, electrical insulators, pump and valve components and satellite and radar electronics systems.<br><br>Leaving aside major applications, such as LEDs and semiconductors, demand for high purity alumina has been growing in some of the relatively smaller applications also due to its versatility. For instance, translucent High Purity Alumina ceramics find application in sodium lamps that employ an electrical gas discharge in sodium vapor for creating light. High Purity Alumina ceramics are utilized for making the luminous tubes, since they are resistant to any reaction with high-temperature sodium vapor. Higher efficiency and luminance of sodium vapor lamps compared to incandescent and fluorescent lamps render them highly effective in illuminating exterior spaces such as roads, streets and public spaces, in addition to factories and sports facilities and being used as light sources for horticulture

E N D
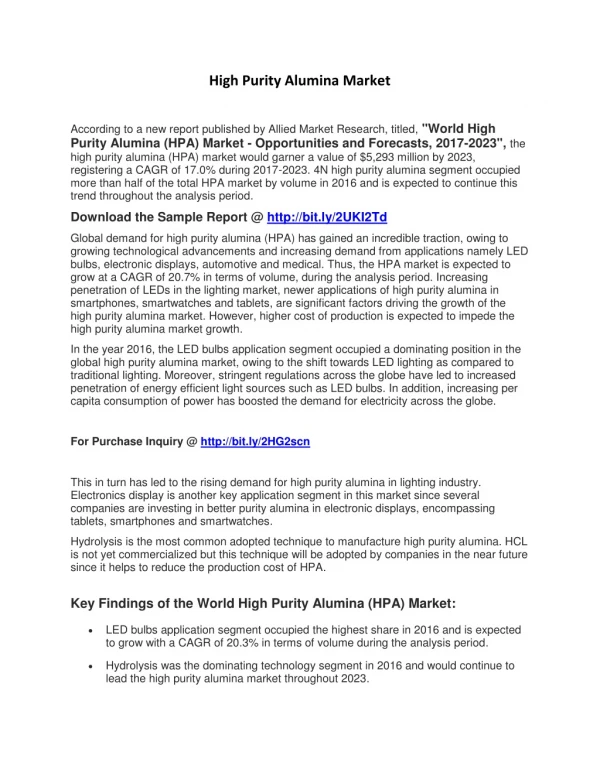
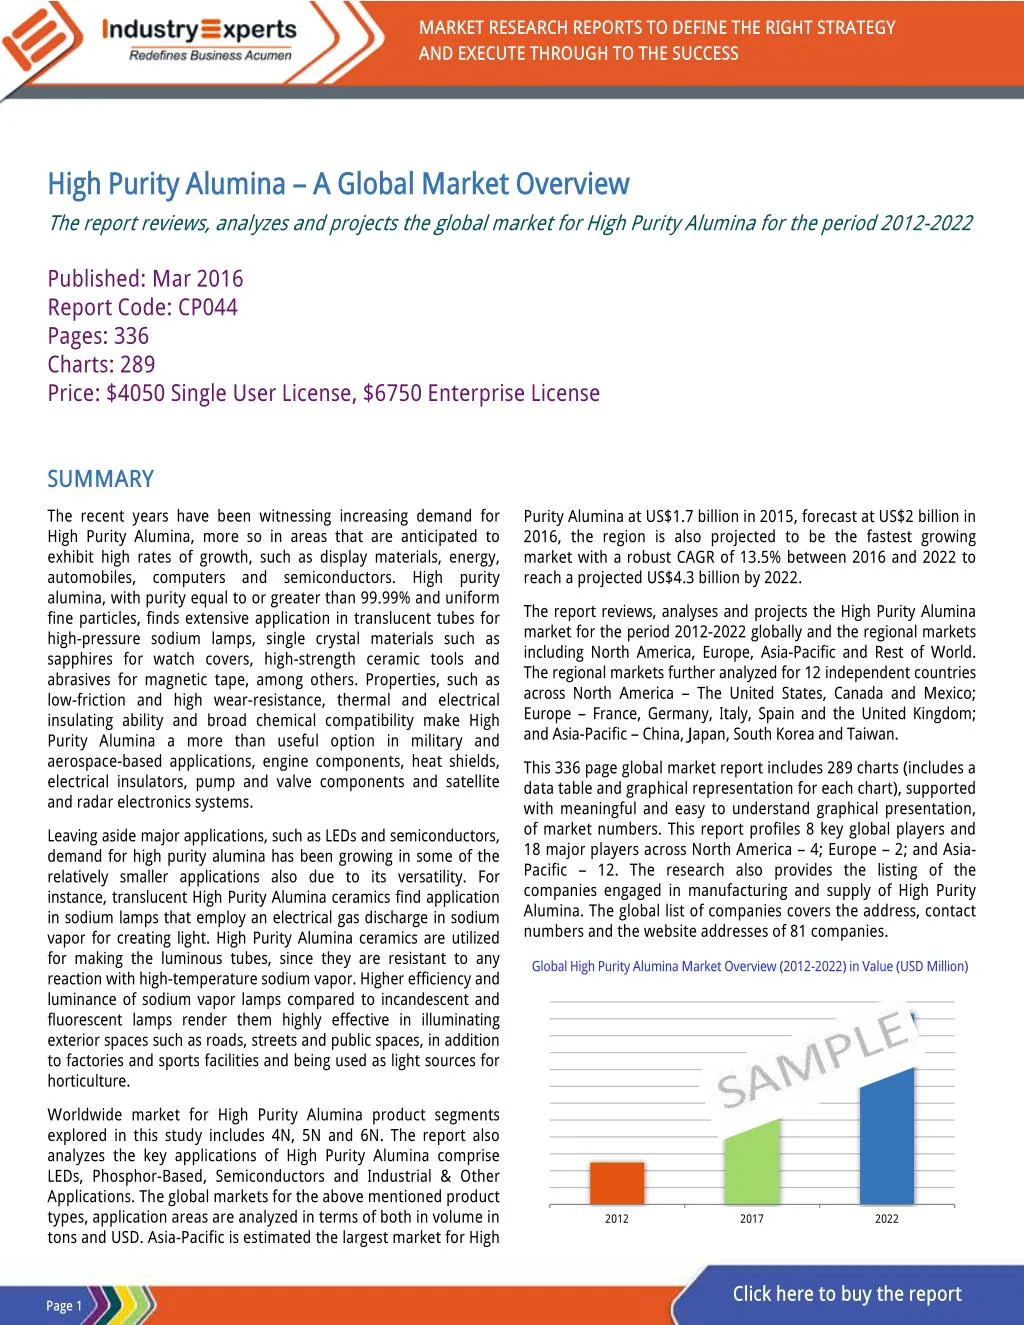
MARKET RESEARCH REPORTS TO DEFINE THE RIGHT STRATEGY AND EXECUTE THROUGH TO THE SUCCESS High Purity Alumina – A Global Market Overview The report reviews, analyzes and projects the global market for High Purity Alumina for the period 2012-2022 Published: Mar 2016 Report Code: CP044 Pages: 336 Charts: 289 Price: $4050 Single User License, $6750 Enterprise License SUMMARY The recent years have been witnessing increasing demand for High Purity Alumina, more so in areas that are anticipated to exhibit high rates of growth, such as display materials, energy, automobiles, computers and semiconductors. High purity alumina, with purity equal to or greater than 99.99% and uniform fine particles, finds extensive application in translucent tubes for high-pressure sodium lamps, single crystal materials such as sapphires for watch covers, high-strength ceramic tools and abrasives for magnetic tape, among others. Properties, such as low-friction and high wear-resistance, thermal and electrical insulating ability and broad chemical compatibility make High Purity Alumina a more than useful option in military and aerospace-based applications, engine components, heat shields, electrical insulators, pump and valve components and satellite and radar electronics systems. Purity Alumina at US$1.7 billion in 2015, forecast at US$2 billion in 2016, the region is also projected to be the fastest growing market with a robust CAGR of 13.5% between 2016 and 2022 to reach a projected US$4.3 billion by 2022. The report reviews, analyses and projects the High Purity Alumina market for the period 2012-2022 globally and the regional markets including North America, Europe, Asia-Pacific and Rest of World. The regional markets further analyzed for 12 independent countries across North America – The United States, Canada and Mexico; Europe – France, Germany, Italy, Spain and the United Kingdom; and Asia-Pacific – China, Japan, South Korea and Taiwan. This 336 page global market report includes 289 charts (includes a data table and graphical representation for each chart), supported with meaningful and easy to understand graphical presentation, of market numbers. This report profiles 8 key global players and 18 major players across North America – 4; Europe – 2; and Asia- Pacific – 12. The research also provides the listing of the companies engaged in manufacturing and supply of High Purity Alumina. The global list of companies covers the address, contact numbers and the website addresses of 81 companies. Leaving aside major applications, such as LEDs and semiconductors, demand for high purity alumina has been growing in some of the relatively smaller applications also due to its versatility. For instance, translucent High Purity Alumina ceramics find application in sodium lamps that employ an electrical gas discharge in sodium vapor for creating light. High Purity Alumina ceramics are utilized for making the luminous tubes, since they are resistant to any reaction with high-temperature sodium vapor. Higher efficiency and luminance of sodium vapor lamps compared to incandescent and fluorescent lamps render them highly effective in illuminating exterior spaces such as roads, streets and public spaces, in addition to factories and sports facilities and being used as light sources for horticulture. Global High Purity Alumina Market Overview (2012-2022) in Value (USD Million) Worldwide market for High Purity Alumina product segments explored in this study includes 4N, 5N and 6N. The report also analyzes the key applications of High Purity Alumina comprise LEDs, Phosphor-Based, Semiconductors and Industrial & Other Applications. The global markets for the above mentioned product types, application areas are analyzed in terms of both in volume in tons and USD. Asia-Pacific is estimated the largest market for High 2012 2017 2022 Click here to buy the report Page 1
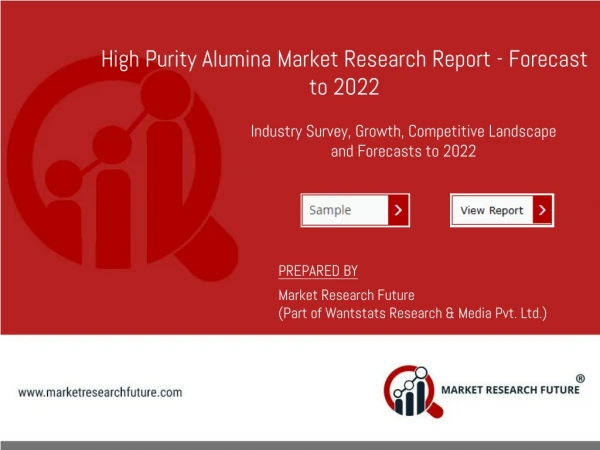
High Purity Alumina – A Global Market Overview Mar 2016 |336 Pages | 289 Charts | Price $4050 SAMPLE TABLE/CHART Glance at 2017 Global High Purity Alumina Volume Market Share (%) by Product Segment – 4N, 5N and 6N SAMPLE COMPANY PROFILE BAIKOWSKI SAS (FRANCE) Les Marais Noirs, BP501, Cedex La Balme de Sillingy, 74339 France Phone: 33 4 50 22 69 02 Fax: 33 4 50 22 28 92 Website: www.baikowski.com Business Overview Baikowski SAS, established in 1904 and headquartered in La Balme de Sillingy, France, is an operating subsidiary of PSB Industries SA. The company and its subsidiaries are engaged in producing and distributing high purity alumina powders and formulations primarily in France, Japan and the United States. Baikowski’s other activities include production of specialty powders of zirconia, spinel and nanophosphors, in addition to YAG powders and ceramics and polishing suspensions. The company’s solutions find a wide variety of application in the lighting, watches and jewelry, health and medicine, plasma TV and microelectronics markets, in addition to sectors in the areas of technical ceramics, bioceramics, crystals, precision polishing, functional additives and coatings, UV reflection, phosphor and transparent armor. Other than production plants in Annecy, France and Malakoff, Texas, Baikowski also operates polishing slurries formulation and application labs in Charlotte, North Carolina and Chiba, Japan. Global High Purity Alumina Market Analysis (2012-2022) by Geographic Region – North America, Europe, Asia-Pacific and Rest of World in Tons 2012 2017 2022 KEY PLAYERS PROFILED •Airy Technology Co Ltd •Altech Chemicals Ltd •Baikowski SAS •Coorstek, Inc. •Dalian Hiland Photoelectric Material Co Ltd •HMR Co Ltd •HPA Sonics •Nippon Light Metal Co Ltd •Orbite Technologies Inc. •PhiChem Corporation •Polar Sapphire Ltd. •Sasol Germany GmbH •Sumitomo Chemical Co Ltd •Taimei Chemicals Co Ltd •Xuancheng Jingrui New Materials Co Ltd •Zibo Honghe Chemical Co Ltd •Zibo Xinfumeng Chemicals Co Ltd •Zibo Xinmeiyu Alumina Co Ltd Product Portfolio Product Particulars Baikalox B-Series Comprises high crystallinity alumina powders developed specifically for specialty ceramics, coatings and precision applications UV-reflective polishing Baikalox Regular Alumina powders providing consistency ensured via stringent quality control procedures over the entire production process High Density Alumina Developed specifically for sapphire applications and offered in tailored sizes and shapes as casted or pressed ceramics, Verneuil crackle and alumina beads …………………….more …………………….more Click here to buy the report Page 2
High Purity Alumina – A Global Market Overview Mar 2016 |336 Pages | 289 Charts | Price $4050 TABLE OF CONTENTS Orbite Technologies Granted US Fly Ash Monetization Patent ............................................................................. 28 First Samples of Orbite’s 5N+ High Purity Alumina Dispatched ...................................................................... 28 Altech Chemicals Obtains Land in Malaysia for HPA Plant . 28 Orbite and NRC in a HPA Benchmarking Deal ................. 29 Sasol Performance Chemicals’ Alumina Spheres Production Capacity Expanded ....................................... 29 Orbite Aluminae on Target for Producing Ultra High Purity Alumina .......................................................................... 30 Construction of Orbite’s HPA Manufacturing Plant Commences .................................................................... 30 Orbite Procures Technology from Outotec for its HPA Plant . 30 Over 99.9% High Purity Alumina Produced by AMMG .... 30 Orbite’s First Ton of HPA Produced at its Cap-Chat, Québec Plant .................................................................. 31 Sumitomo Chemical’s South Korea Plant to Commence HPA Production ............................................................... 31 Sasol Limited Plans Expansion of Ultra-High Purity Alumina production Capacity ........................................................ 31 6.1.2.1.2 5N High Purity Alumina ............................. 45 Chart 18: Global 5N High Purity Alumina Market Analysis (2012-2022) by Geographic Region – North America, Europe, Asia-Pacific and Rest of World in USD Million.... 45 Chart 19: Glance at 2012, 2017 and 2022 Global 5N High Purity Alumina Value Market Share (%) by Geographic Region – North America, Europe, Asia-Pacific and Rest of World ............................................................................. 46 6.1.2.1.3 6N High Purity Alumina ............................. 47 Chart 20: Global 6N High Purity Alumina Market Analysis (2012-2022) by Geographic Region – North America, Europe, Asia-Pacific and Rest of World in USD Million.... 47 Chart 21: Glance at 2012, 2017 and 2022 Global 6N High Purity Alumina Value Market Share (%) by Geographic Region – North America, Europe, Asia-Pacific and Rest of World ............................................................................. 48 6.2 Global High Purity Alumina Market Overview by Application .............................................................. 49 6.2.1 Market Analysis in Tons .................................. 49 Chart 22: Global High Purity Alumina Market Analysis (2012-2022) by Application – LEDs, Phosphor-Based, Semiconductors and Industrial & Other Applications in Tons ................................................................................ 49 Chart 23: Glance at 2012, 2017 and 2022 Global High Purity Alumina Volume Market Share (%) by Application – LEDs, Phosphor-Based, Semiconductors and Industrial & Other Applications .......................................................... 50 6.2.1.1 Global High Purity Alumina Application Volume Overview by Global Region ........................ 51 6.2.1.1.1 LEDs .......................................................... 51 Chart 24: Global High Purity Alumina Market Analysis (2012-2022) in LEDs by Geographic Region – North America, Europe, Asia-Pacific and Rest of World in Tons 51 Chart 25: Glance at 2012, 2017 and 2022 Global High Purity Alumina Volume Market Share (%) in LEDs by Geographic Region – North America, Europe, Asia-Pacific and Rest of World ........................................................... 52 6.2.1.1.2 Phosphor-Based Applications ................... 53 Chart 26: Global High Purity Alumina Market Analysis (2012-2022) in Phosphor-Based Applications by Geographic Region – North America, Europe, Asia-Pacific and Rest of World in Tons .............................................. 53 Chart 27: Glance at 2012, 2017 and 2022 Global High Purity Alumina Volume Market Share (%) in Phosphor- Based Applications by Geographic Region – North America, Europe, Asia-Pacific and Rest of World ............ 54 6.2.1.1.3 Semiconductors ........................................ 55 Chart 28: Global High Purity Alumina Market Analysis (2012-2022) in Semiconductors by Geographic Region – North America, Europe, Asia-Pacific and Rest of World in Tons ................................................................................ 55 Chart 29: Glance at 2012, 2017 and 2022 Global High Purity Alumina Volume Market Share (%) in Semiconductors by Geographic Region – North America, Europe, Asia-Pacific and Rest of World ........................... 56 6.2.1.1.4 Industrial & Other Applications ................ 57 Chart 30: Global High Purity Alumina Market Analysis (2012-2022) in Industrial & Other Applications by Geographic Region – North America, Europe, Asia-Pacific and Rest of World in Tons .............................................. 57 Chart 31: Glance at 2012, 2017 and 2022 Global High Purity Alumina Volume Market Share (%) in Industrial & Other Applications by Geographic Region – North America, Europe, Asia-Pacific and Rest of World ........................... 58 6.2.2 Market Analysis in USD ................................... 59 Chart 32: Global High Purity Alumina Market Analysis (2012-2022) by Application – LEDs, Phosphor-Based, Semiconductors and Industrial & Other Applications in USD Million ..................................................................... 59 Chart 33: Glance at 2012, 2017 and 2022 Global High Purity Alumina Value Market Share (%) by Application – LEDs, Phosphor-Based, Semiconductors and Industrial & Other Applications .......................................................... 60 PART A: GLOBAL MARKET PERSPECTIVE ........ 1 1. INTRODUCTION .................................................. 1 1.1 Product Outline .................................................... 3 1.1.1 What is High Purity Alumina? ........................... 3 1.1.2 Production of High Purity Alumina ................... 3 1.1.2.1 Hydrolysis of Aluminum Alkoxide .................. 3 1.1.2.2 In-situ Chemical Vapor Deposition ................. 5 2. HIGH PURITY ALUMINA APPLICATIONS – A MARKET SNAPSHOT ............................................... 6 2.1 Light Emitting Diodes (LEDs) ................................ 6 Chart 1: Trending of High Purity Alumina Global Consumption in LED Applications (2016-2022) in Tons..... 6 2.1.1 Production of Industrial Sapphires .................... 7 2.1.1.1 Verneuil Method ............................................ 7 2.1.1.2 Czochralski Method (CZ) ................................ 7 2.1.1.3 Kyropoulos Method ....................................... 8 2.1.1.4 Heat Exchanger Method (HEM) ..................... 8 2.1.1.5 Edge-Defined Film-Fed Growth Method (EFG) .... 9 2.2 Phosphor-Based Applications ............................ 10 Chart 2: Trending of High Purity Alumina Global Consumption in Phosphor-Based Applications (2016-2022) in Tons .............................................................................10 2.3 Semiconductors ................................................. 11 Chart 3: Trending of High Purity Alumina Global Consumption in Semiconductor Applications (2016-2022) in Tons .............................................................................11 2.4 Industrial & Other Applications ......................... 12 Chart 4: Trending of High Purity Alumina Global Consumption in Semiconductor Applications (2016-2022) in Tons .............. 12 2.4.1 Abrasives......................................................... 12 2.4.2 Automotive Sensors ........................................ 13 2.4.3 Ceramics ......................................................... 13 2.4.4 Medical ........................................................... 13 2.4.5 Separation Membranes .................................. 13 2.4.6 Sodium Vapor Lamps ...................................... 14 3. KEY MARKET TRENDS ........................................ 15 3.1 Growth in Demand for High Purity Alumina Being Propelled by the LED Industry ................................. 15 3.2 LED Sapphires Witnessing Competition from Alternative Technologies ......................................... 16 3.3 Will Smartphones Make the “Smart” Move to Sapphire Glass?........................................................ 16 3.4 Lithium-Ion Batteries Emerging as a New Opening for High Purity Alumina ........................................... 17 3.5 Smaller Applications, too, Driving the Market for HPA .......................................................................... 18 3.6 Alternative Method for Preparing High-Purity, High-Density Alumina Green Body Provides Higher Output ..................................................................... 18 6. GLOBAL MARKET OVERVIEW ............................. 32 Chart 5: Global High Purity Alumina Market Overview (2012-2022) in Volume (Tons) and Value (USD Million) .. 32 6.1 Global High Purity Alumina Market Overview by Product Segment .................................................... 33 6.1.1 Market Analysis in Tons .................................. 33 Chart 6: Global High Purity Alumina Market Analysis (2012- 2022) by Product Segment – 4N, 5N and 6N in Tons .......... 33 Chart 7: Glance at 2012, 2017 and 2022 Global High Purity Alumina Volume Market Share (%) by Product Segment – 4N, 5N and 6N ................................................................. 34 6.1.1.1 High Purity Alumina Product Segment Volume Market Overview by Global Region ......................... 35 6.1.1.1.1 4N High Purity Alumina ............................. 35 Chart 8: Global 4N High Purity Alumina Market Analysis (2012-2022) by Geographic Region – North America, Europe, Asia-Pacific and Rest of World in Tons ............... 35 Chart 9: Glance at 2012, 2017 and 2022 Global 4N High Purity Alumina Volume Market Share (%) by Geographic Region – North America, Europe, Asia-Pacific and Rest of World .............................................................................. 36 6.1.1.1.2 5N High Purity Alumina ............................. 37 Chart 10: Global 5N High Purity Alumina Market Analysis (2012-2022) by Geographic Region – North America, Europe, Asia-Pacific and Rest of World in Tons ............... 37 Chart 11: Glance at 2012, 2017 and 2022 Global 5N High Purity Alumina Volume Market Share (%) by Geographic Region – North America, Europe, Asia-Pacific and Rest of World .............................................................................. 38 6.1.1.1.3 6N High Purity Alumina ............................. 39 Chart 12: Global 6N High Purity Alumina Market Analysis (2012-2022) by Geographic Region – North America, Europe, Asia-Pacific and Rest of World in Tons ............... 39 Chart 13: Glance at 2012, 2017 and 2022 Global 6N High Purity Alumina Volume Market Share (%) by Geographic Region – North America, Europe, Asia-Pacific and Rest of World .............................................................................. 40 6.1.2 Market Analysis in USD ................................... 41 Chart 14: Global High Purity Alumina Market Analysis (2012-2022) by Product Segment – 4N, 5N and 6N in USD Million ............................................................................. 41 Chart 15: Glance at 2012, 2017 and 2022 Global High Purity Alumina Value Market Share (%) by Product Segment – 4N, 5N and 6N ............................................... 42 6.1.2.1 Global High Purity Alumina Product Segment Value Market Overview by Global Region ............... 43 6.1.2.1.1 4N High Purity Alumina ............................. 43 Chart 16: Global 4N High Purity Alumina Market Analysis (2012-2022) by Geographic Region – North America, Europe, Asia-Pacific and Rest of World in USD Million .... 43 Chart 17: Glance at 2012, 2017 and 2022 Global 4N High Purity Alumina Value Market Share (%) by Geographic Region – North America, Europe, Asia-Pacific and Rest of World ......... 44 4. KEY GLOBAL PLAYERS ........................................ 19 Altech Chemicals Ltd (Australia) ......................................19 Baikowski Sas (France) ....................................................20 Coorstek, Inc. (United States) ..........................................21 Nippon Light Metal Co Ltd (Japan)...................................22 Orbite Technologies Inc. (Canada) ...................................23 Polar Sapphire Ltd. (Canada) ...........................................24 Sasol Germany GmbH (Germany) ....................................25 Sumitomo Chemical Co Ltd (Japan) .................................26 5. KEY BUSINESS TRENDS ...................................... 27 Additional Samples of 5N and 5N+ Alpha High Purity Alumina Shipped by Orbite ..............................................27 Altech Chemicals Eyes Chinese Market for High Purity Alumina, Partners with Mitsubishi ..................................27 Additional Samples of 5N+ Alpha High Purity Alumina Shipped by Orbite ............................................................27 Altech Chemicals to Offer Low Cost HPA .........................27 Altech Chemicals Expands Western Australian Kaolin Operations ......................................................................28 Click here to buy the report Page 3
High Purity Alumina – A Global Market Overview Mar 2016 |336 Pages | 289 Charts | Price $4050 Chart 69: Glance at 2012, 2017 and 2022 North American High Purity Alumina Volume Market Share (%) by Application – LEDs, Phosphor-Based, Semiconductors and Industrial & Other Applications ...................................... 96 1.3.1.1 High Purity Alumina Application Volume Market Overview by NA Region ............................... 97 1.3.1.1.1 LEDs .......................................................... 97 Chart 70: North American High Purity Alumina Market Analysis (2012-2022) in LEDs by Geographic Region – United States, Canada and Mexico in Tons ..................... 97 Chart 71: Glance at 2012, 2017 and 2022 North American High Purity Alumina Volume Market Share (%) in LEDs by Geographic Region – United States, Canada and Mexico 98 1.3.1.1.2 Phosphor-Based Applications ................... 99 Chart 72: North American High Purity Alumina Market Analysis (2012-2022) in Phosphor-Based Applications by Geographic Region – United States, Canada and Mexico in Tons ................................................................................ 99 Chart 73: Glance at 2012, 2017 and 2022 North American High Purity Alumina Volume Market Share (%) in Phosphor-Based Applications by Geographic Region – United States, Canada and Mexico ............................... 100 1.3.1.1.3 Semiconductors ...................................... 101 Chart 74: North American High Purity Alumina Market Analysis (2012-2022) in Semiconductors by Geographic Region – United States, Canada and Mexico in Tons .... 101 Chart 75: Glance at 2012, 2017 and 2022 North American High Purity Alumina Volume Market Share (%) in Semiconductors by Geographic Region – United States, Canada and Mexico ...................................................... 102 1.3.1.1.4 Industrial & Other Applications .............. 103 Chart 76: North American High Purity Alumina Market Analysis (2012-2022) in Industrial & Other Applications by Geographic Region – United States, Canada and Mexico in Tons ............ 103 Chart 77: Glance at 2012, 2017 and 2022 North American High Purity Alumina Volume Market Share (%) in Industrial & Other Applications by Geographic Region – United States, Canada and Mexico ........................................... 104 1.3.2 Market Analysis in USD ................................. 105 Chart 78: North American High Purity Alumina Market Analysis (2012-2022) by Application – LEDs, Phosphor- Based, Semiconductors and Industrial & Other Applications in USD Million .......................................... 105 Chart 79: Glance at 2012, 2017 and 2022 North American High Purity Alumina Value Market Share (%) by Application – LEDs, Phosphor-Based, Semiconductors and Industrial & Other Applications .................................... 106 1.3.2.1 High Purity Alumina Application Value Market Overview by NA Region ......................................... 107 1.3.2.1.1 LEDs ........................................................ 107 Chart 80: North American High Purity Alumina Market Analysis (2012-2022) in LEDs by Geographic Region – United States, Canada and Mexico in USD Million ........ 107 Chart 81: Glance at 2012, 2017 and 2022 North American High Purity Alumina Value Market Share (%) in LEDs by Geographic Region – United States, Canada and Mexico . 108 1.3.2.1.2 Phosphor-Based Applications ................. 109 Chart 82: North American High Purity Alumina Market Analysis (2012-2022) in Phosphor-Based Applications by Geographic Region – United States, Canada and Mexico in USD Million ................................................................... 109 Chart 83: Glance at 2012, 2017 and 2022 North American High Purity Alumina Value Market Share (%) in Phosphor- Based Applications by Geographic Region – United States, Canada and Mexico ...................................................... 110 1.3.2.1.3 Semiconductors ...................................... 111 Chart 84: North American High Purity Alumina Market Analysis (2012-2022) in Semiconductors by Geographic Region – United States, Canada and Mexico in USD Million ........................... 111 Chart 85: Glance at 2012, 2017 and 2022 North American High Purity Alumina Value Market Share (%) in Semiconductors by Geographic Region – United States, Canada and Mexico .... 112 1.3.2.1.4 Industrial & Other Applications .............. 113 Chart 86: North American High Purity Alumina Market Analysis (2012-2022) in Industrial & Other Applications by Geographic Region – United States, Canada and Mexico in USD Million ................................................................... 113 6.2.2.1 Global High Purity Alumina Application Value Market Overview by Geographic Region ................. 61 6.2.2.1.1 LEDs .......................................................... 61 Chart 34: Global High Purity Alumina Market Analysis (2012-2022) in LEDs by Geographic Region – North America, Europe, Asia-Pacific and Rest of World in USD Million .............................................................................61 Chart 35: Glance at 2012, 2017 and 2022 Global High Purity Alumina Value Market Share (%) in LEDs by Geographic Region – North America, Europe, Asia-Pacific and Rest of World............................................................62 6.2.2.1.2 Phosphor-Based Applications ................... 63 Chart 36: Global High Purity Alumina Market Analysis (2012-2022) in Phosphor-Based Applications by Geographic Region – North America, Europe, Asia-Pacific and Rest of World in USD Million ....................................63 Chart 37: Glance at 2012, 2017 and 2022 Global High Purity Alumina Value Market Share (%) in Phosphor-Based Applications by Geographic Region – North America, Europe, Asia-Pacific and Rest of World ............................64 6.2.2.1.3 Semiconductors ........................................ 65 Chart 38: Global High Purity Alumina Market Analysis (2012-2022) in Semiconductors by Geographic Region – North America, Europe, Asia-Pacific and Rest of World in USD Million .....................................................................65 Chart 39: Glance at 2012, 2017 and 2022 Global High Purity Alumina Value Market Share (%) in Semiconductors by Geographic Region – North America, Europe, Asia- Pacific and Rest of World.................................................66 6.2.2.1.4 Industrial & Other Applications................. 67 Chart 40: Global High Purity Alumina Market Analysis (2012-2022) in Industrial & Other Applications by Geographic Region – North America, Europe, Asia-Pacific and Rest of World in USD Million ....................................67 Chart 41: Glance at 2012, 2017 and 2022 Global High Purity Alumina Value Market Share (%) in Industrial & Other Applications by Geographic Region – North America, Europe, Asia-Pacific and Rest of World ............................68 1.1.2 Market Analysis in USD ................................... 77 Chart 50: North American High Purity Alumina Market Analysis (2012-2022) by Geographic Region – United States, Canada and Mexico in USD Million ...................... 77 Chart 51: Glance at 2012, 2017 and 2022 North American High Purity Alumina Value Market Share (%) by Geographic Region – United States, Canada and Mexico 78 1.2 North American High Purity Alumina Market Overview by Product Segment ................................ 79 1.2.1 Market Analysis in Tons .................................. 79 Chart 52: North American High Purity Alumina Market Analysis (2012-2022) by Product Segment – 4N, 5N and 6N in Tons ............................................................................ 79 Chart 53: Glance at 2012, 2017 and 2022 North American High Purity Alumina Volume Market Share (%) by Product Segment – 4N, 5N and 6N ............................................... 80 1.2.1.1 High Purity Alumina Product Segment Volume Market Overview by NA Region ............................... 81 1.2.1.1.1 4N High Purity Alumina ............................. 81 Chart 54: North American 4N High Purity Alumina Market Analysis (2012-2022) by Geographic Region – United States, Canada and Mexico in Tons ................................. 81 Chart 55: Glance at 2012, 2017 and 2022 North American 4N High Purity Alumina Volume Market Share (%) by Geographic Region – United States, Canada and Mexico 82 1.2.1.1.2 5N High Purity Alumina ............................. 83 Chart 56: North American 5N High Purity Alumina Market Analysis (2012-2022) by Geographic Region – United States, Canada and Mexico in Tons ................................. 83 Chart 57: Glance at 2012, 2017 and 2022 North American 5N High Purity Alumina Volume Market Share (%) by Geographic Region – United States, Canada and Mexico 84 1.2.1.1.3 6N High Purity Alumina ............................. 85 Chart 58: North American 6N High Purity Alumina Market Analysis (2012-2022) by Geographic Region – United States, Canada and Mexico in Tons ................................. 85 Chart 59: Glance at 2012, 2017 and 2022 North American 6N High Purity Alumina Volume Market Share (%) by Geographic Region – United States, Canada and Mexico 86 1.2.2 Market Analysis in USD ................................... 87 Chart 60: North American High Purity Alumina Market Analysis (2012-2022) by Product Segment – 4N, 5N and 6N in USD Million ................................................................. 87 Chart 61: Glance at 2012, 2017 and 2022 North American High Purity Alumina Value Market Share (%) by Product Segment – 4N, 5N and 6N ............................................... 88 1.2.2.1 High Purity Alumina Product Segment Value Market Overview by NA Region ............................... 89 1.2.2.1.1 4N High Purity Alumina ............................. 89 Chart 62: North American 4N High Purity Alumina Market Analysis (2012-2022) by Geographic Region – United States, Canada and Mexico in USD Million ...................... 89 Chart 63: Glance at 2012, 2017 and 2022 North American 4N High Purity Alumina Value Market Share (%) by Geographic Region – United States, Canada and Mexico 90 1.2.2.1.2 5N High Purity Alumina ............................. 91 Chart 64: North American 5N High Purity Alumina Market Analysis (2012-2022) by Geographic Region – United States, Canada and Mexico in USD Million ...................... 91 Chart 65: Glance at 2012, 2017 and 2022 North American 5N High Purity Alumina Value Market Share (%) by Geographic Region – United States, Canada and Mexico 92 1.2.2.1.3 6N High Purity Alumina ............................. 93 Chart 66: North American 6N High Purity Alumina Market Analysis (2012-2022) by Geographic Region – United States, Canada and Mexico in USD Million ...................... 93 Chart 67: Glance at 2012, 2017 and 2022 North American 6N High Purity Alumina Value Market Share (%) by Geographic Region – United States, Canada and Mexico 94 1.3 North American High Purity Alumina Market Overview by Application .......................................... 95 1.3.1 Market Analysis in Tons .................................. 95 Chart 68: North American High Purity Alumina Market Analysis (2012-2022) by Application – LEDs, Phosphor- Based, Semiconductors and Industrial & Other Applications in Tons ........................................................ 95 PART B: REGIONAL MARKET PERSPECTIVE ... 69 Chart 42: The Largest Independent Regions in Terms of Projected Growth (2016-2022) for High Purity Alumina Market by Geographic Region – North America, Europe and Asia-Pacific ...............................................................69 Global High Purity Alumina Market Overview by Geographic Region ............................................... 70 Market Analysis in Tons ........................................ 70 Chart 43: Global High Purity Alumina Market Analysis (2012-2022) by Geographic Region – North America, Europe, Asia-Pacific and Rest of World in Tons ...............70 Chart 44: Glance at 2012, 2017 and 2022 Global High Purity Alumina Volume Market Share (%) by Geographic Region – North America, Europe, Asia-Pacific and Rest of World ..............................................................................71 Market Analysis in USD ......................................... 72 Chart 45: Global High Purity Alumina Market Analysis (2012-2022) by Geographic Region – North America, Europe, Asia-Pacific and Rest of World in USD Million ....72 Chart 46: Glance at 2012, 2017 and 2022 Global High Purity Alumina Value Market Share (%) by Geographic Region – North America, Europe, Asia-Pacific and Rest of World ..............................................................................73 REGIONAL MARKET OVERVIEW ............................. 74 1. NORTH AMERICA .............................................. 74 Chart 47: North American High Purity Alumina Market Overview (2012-2022) in Volume (Tons) and Value (USD Million) ............................................................................74 1.1 North American High Purity Alumina Market Overview by Geographic Region .............................. 75 1.1.1 Market Analysis in Tons .................................. 75 Chart 48: North American High Purity Alumina Market Analysis (2012-2022) by Geographic Region – United States, Canada and Mexico in Tons .................................75 Chart 49: Glance at 2012, 2017 and 2022 North American High Purity Alumina Volume Market Share (%) by Geographic Region – United States, Canada and Mexico 76 Click here to buy the report Page 4
High Purity Alumina – A Global Market Overview Mar 2016 |336 Pages | 289 Charts | Price $4050 Chart 87: Glance at 2012, 2017 and 2022 North American High Purity Alumina Value Market Share (%) in Industrial & Other Applications by Geographic Region – United States, Canada and Mexico ....................................................... 114 1.4 Major Market Players ...................................... 115 Coorstek, Inc. (United States) ........................................ 115 Hpa Sonics (United States) ............................................ 116 Orbite Technologies Inc. (Canada) ................................. 116 Polar Sapphire Ltd. (Canada) ......................................... 117 1.5 North American High Purity Alumina Market Overview by Country ............................................. 118 1.5.1 The United States ....................................... 118 1.5.1.1 Market Overview by Product Segment ...... 118 1.5.1.1.1 Market Analysis in Tons .......................... 118 Chart 88: United States High Purity Alumina Market Analysis (2012-2022) by Product Segment – 4N, 5N and 6N in Tons ........................................................................... 118 Chart 89: Glance at 2012, 2017 and 2022 United States High Purity Alumina Volume Market Share (%) by Product Segment – 4N, 5N and 6N ............................................. 119 1.5.1.1.2 Market Analysis in USD ........................... 120 Chart 90: United States High Purity Alumina Market Analysis (2012-2022) by Product Segment – 4N, 5N and 6N in USD Million ................................................................ 120 Chart 91: Glance at 2012, 2017 and 2022 United States High Purity Alumina Value Market Share (%) by Product Segment – 4N, 5N and 6N ............................................. 121 1.5.1.2 Market Overview by Application ............... 122 1.5.1.2.1 Market Analysis in Tons .......................... 122 Chart 92: United States High Purity Alumina Market Analysis (2012-2022) by Application – LEDs, Phosphor- Based, Semiconductors and Industrial & Other Applications in Tons ...................................................... 122 Chart 93: Glance at 2012, 2017 and 2022 United States High Purity Alumina Volume Market Share (%) by Application – LEDs, Phosphor-Based, Semiconductors and Industrial & Other Applications ..................................... 123 1.5.1.2.2 Market Analysis in USD ........................... 124 Chart 94: United States High Purity Alumina Market Analysis (2012-2022) by Application – LEDs, Phosphor- Based, Semiconductors and Industrial & Other Applications in USD Million ........................................... 124 Chart 95: Glance at 2012, 2017 and 2022 United States High Purity Alumina Value Market Share (%) by Application – LEDs, Phosphor-Based, Semiconductors and Industrial & Other Applications ..................................... 125 1.5.2 Canada....................................................... 126 1.5.2.1 Market Overview by Product Segment ...... 126 1.5.2.1.1 Market Analysis in Tons .......................... 126 Chart 96: Canadian High Purity Alumina Market Analysis (2012- 2022) by Product Segment – 4N, 5N and 6N in Tons ............ 126 Chart 97: Glance at 2012, 2017 and 2022 Canadian High Purity Alumina Volume Market Share (%) by Product Segment – 4N, 5N and 6N ............................................. 127 1.5.2.1.2 Market Analysis in USD ........................... 128 Chart 98: Canadian High Purity Alumina Market Analysis (2012-2022) by Product Segment – 4N, 5N and 6N in USD Million ........................................................................... 128 Chart 99: Glance at 2012, 2017 and 2022 Canadian High Purity Alumina Value Market Share (%) by Product Segment – 4N, 5N and 6N ............................................. 129 1.5.2.2 Market Overview by Application ............... 130 1.5.2.2.1 Market Analysis in Tons .......................... 130 Chart 100: Canadian High Purity Alumina Market Analysis (2012-2022) by Application – LEDs, Phosphor-Based, Semiconductors and Industrial & Other Applications in Tons............................................................................... 130 Chart 101: Glance at 2012, 2017 and 2022 Canadian High Purity Alumina Volume Market Share (%) by Application – LEDs, Phosphor-Based, Semiconductors and Industrial & Other Applications ........................................................ 131 1.5.2.2.2 Market Analysis in USD ........................... 132 Chart 102: Canadian High Purity Alumina Market Analysis (2012-2022) by Application – LEDs, Phosphor-Based, Semiconductors and Industrial & Other Applications in USD Million ................................................................... 132 Chart 103: Glance at 2012, 2017 and 2022 Canadian High Purity Alumina Value Market Share (%) by Application – LEDs, Phosphor-Based, Semiconductors and Industrial & Other Applications ........................................................ 133 1.5.3 Mexico ....................................................... 134 1.5.3.1 Market Overview by Product Segment ...... 134 1.5.3.1.1 Market Analysis in Tons .......................... 134 Chart 104: Mexican High Purity Alumina Market Analysis (2012-2022) by Product Segment – 4N, 5N and 6N in Tons . 134 Chart 105: Glance at 2012, 2017 and 2022 Mexican High Purity Alumina Volume Market Share (%) by Product Segment – 4N, 5N and 6N ............................................. 135 1.5.3.1.2 Market Analysis in USD ........................... 136 Chart 106: Mexican High Purity Alumina Market Analysis (2012-2022) by Product Segment – 4N, 5N and 6N in USD Million ........................................................................... 136 Chart 107: Glance at 2012, 2017 and 2022 Mexican High Purity Alumina Value Market Share (%) by Product Segment – 4N, 5N and 6N ............................................. 137 1.5.3.2 Market Overview by Application ............... 138 1.5.3.2.1 Market Analysis in Tons .......................... 138 Chart 108: Mexican High Purity Alumina Market Analysis (2012-2022) by Application – LEDs, Phosphor-Based, Semiconductors and Industrial & Other Applications in Tons .............................................................................. 138 Chart 109: Glance at 2012, 2017 and 2022 Mexican High Purity Alumina Volume Market Share (%) by Application – LEDs, Phosphor-Based, Semiconductors and Industrial & Other Applications ........................................................ 139 1.5.3.2.2 Market Analysis in USD ........................... 140 Chart 110: Mexican High Purity Alumina Market Analysis (2012-2022) by Application – LEDs, Phosphor-Based, Semiconductors and Industrial & Other Applications in USD Million ................................................................... 140 Chart 111: Glance at 2012, 2017 and 2022 Mexican High Purity Alumina Value Market Share (%) by Application – LEDs, Phosphor-Based, Semiconductors and Industrial & Other Applications ........................................................ 141 Chart 120: Glance at 2012, 2017 and 2022 4N European High Purity Alumina Volume Market Share (%) by Geographic Region – France, Germany, Italy, Spain, United Kingdom and Rest of Europe ........................................ 150 2.2.1.1.2 5N High Purity Alumina ........................... 151 Chart 121: European 5N High Purity Alumina Market Analysis (2012-2022) by Geographic Region – France, Germany, Italy, Spain, United Kingdom and Rest of Europe in Tons .......................................................................... 151 Chart 122: Glance at 2012, 2017 and 2022 5N European High Purity Alumina Volume Market Share (%) by Geographic Region – France, Germany, Italy, Spain, United Kingdom and Rest of Europe ........................................ 152 2.2.1.1.3 6N High Purity Alumina ........................... 153 Chart 123: European 6N High Purity Alumina Market Analysis (2012-2022) by Geographic Region – France, Germany, Italy, Spain, United Kingdom and Rest of Europe in Tons .......................................................................... 153 Chart 124: Glance at 2012, 2017 and 2022 6N European High Purity Alumina Volume Market Share (%) by Geographic Region – France, Germany, Italy, Spain, United Kingdom and Rest of Europe ........................................ 154 2.2.2 Market Analysis in USD ................................. 155 Chart 125: European High Purity Alumina Market Analysis (2012-2022) by Product Segment – 4N, 5N and 6N in USD Million .......................................................................... 155 Chart 126: Glance at 2012, 2017 and 2022 European High Purity Alumina Value Market Share (%) by Product Segment – 4N, 5N and 6N............................................. 156 2.2.2.1 High Purity Alumina Product Segment Value Market Overview by European Region .................. 157 2.2.2.1.1 4N High Purity Alumina ........................... 157 Chart 127: European 4N High Purity Alumina Market Analysis (2012-2022) by Geographic Region – France, Germany, Italy, Spain, United Kingdom and Rest of Europe in USD Million ............................................................... 157 Chart 128: Glance at 2012, 2017 and 2022 European 4N High Purity Alumina Value Market Share (%) by Geographic Region – France, Germany, Italy, Spain, United Kingdom and Rest of Europe ........................................ 158 2.2.2.1.2 5N High Purity Alumina ........................... 159 Chart 129: European 5N High Purity Alumina Market Analysis (2012-2022) by Geographic Region – France, Germany, Italy, Spain, United Kingdom and Rest of Europe in USD Million ............................................................... 159 Chart 130: Glance at 2012, 2017 and 2022 European 5N High Purity Alumina Value Market Share (%) by Geographic Region – France, Germany, Italy, Spain, United Kingdom and Rest of Europe ........................................ 160 2.2.2.1.3 6N High Purity Alumina ........................... 161 Chart 131: European 6N High Purity Alumina Market Analysis (2012-2022) by Geographic Region – France, Germany, Italy, Spain, United Kingdom and Rest of Europe in USD Million ............................................................... 161 Chart 132: Glance at 2012, 2017 and 2022 European 6N High Purity Alumina Value Market Share (%) by Geographic Region – France, Germany, Italy, Spain, United Kingdom and Rest of Europe ........................................ 162 2.3 European High Purity Alumina Market Overview by Application ........................................................ 163 2.3.1 Market Analysis in Tons ................................ 163 Chart 133: European High Purity Alumina Market Analysis (2012-2022) by Application – LEDs, Phosphor-Based, Semiconductors and Industrial & Other Applications in Tons .............................................................................. 163 Chart 134: Glance at 2012, 2017 and 2022 European High Purity Alumina Volume Market Share (%) by Application – LEDs, Phosphor-Based, Semiconductors and Industrial & Other Applications ........................................................ 164 2.3.1.1 High Purity Alumina Application Volume Market Overview by European Region .................. 165 2.3.1.1.1 LEDs ........................................................ 165 Chart 135: European High Purity Alumina Market Analysis (2012-2022) in LEDs by Geographic Region – France, Germany, Italy, Spain, United Kingdom and Rest of Europe in Tons .......................................................................... 165 2. EUROPE .......................................................... 142 Chart 112: European High Purity Alumina Market Overview (2012-2022) in Volume (Tons) and Value (USD Million) ......................................................................... 142 2.1 European High Purity Alumina Market Overview by Geographic Region ............................................ 143 2.1.1 Market Analysis in Tons ................................ 143 Chart 113: European High Purity Alumina Market Analysis (2012-2022) by Geographic Region – France, Germany, Italy, Spain, United Kingdom and Rest of Europe in Tons .......... 143 Chart 114: Glance at 2012, 2017 and 2022 European High Purity Alumina Volume Market Share (%) by Geographic Region – France, Germany, Italy, Spain, United Kingdom and Rest of Europe ........................................................ 144 2.1.2 Market Analysis in USD ................................. 145 Chart 115: European High Purity Alumina Market Analysis (2012-2022) by Geographic Region – France, Germany, Italy, Spain, United Kingdom and Rest of Europe in USD Million ........................................................................... 145 Chart 116: Glance at 2012, 2017 and 2022 European High Purity Alumina Value Market Share (%) by Geographic Region – France, Germany, Italy, Spain, United Kingdom and Rest of Europe ........................................................ 146 2.2 European High Purity Alumina Market Overview by Product Segment .............................................. 147 2.2.1 Market Analysis in Tons ................................ 147 Chart 117: European High Purity Alumina Market Analysis (2012-2022) by Product Segment – 4N, 5N and 6N in Tons . 147 Chart 118: Glance at 2012, 2017 and 2022 European High Purity Alumina Volume Market Share (%) by Product Segment – 4N, 5N and 6N ............................................. 148 2.2.1.1 High Purity Alumina Product Segment Volume Market Overview by European Region .................. 149 2.2.1.1.1 4N High Purity Alumina ........................... 149 Chart 119: European 4N High Purity Alumina Market Analysis (2012-2022) by Geographic Region – France, Germany, Italy, Spain, United Kingdom and Rest of Europe in Tons .............. 149 Click here to buy the report Page 5
High Purity Alumina – A Global Market Overview Mar 2016 |336 Pages | 289 Charts | Price $4050 Chart 136: Glance at 2012, 2017 and 2022 European High Purity Alumina Volume Market Share (%) in LEDs by Geographic Region – France, Germany, Italy, Spain, United Kingdom and Rest of Europe ......................................... 166 2.3.1.1.2 Phosphor-Based Applications ................. 167 Chart 137: European High Purity Alumina Market Analysis (2012-2022) in Phosphor-Based by Geographic Region – France, Germany, Italy, Spain, United Kingdom and Rest of Europe in Tons .............................................................. 167 Chart 138: Glance at 2012, 2017 and 2022 European High Purity Alumina Volume Market Share (%) in Phosphor- Based by Geographic Region – France, Germany, Italy, Spain, United Kingdom and Rest of Europe ................... 168 2.3.1.1.3 Semiconductors ...................................... 169 Chart 139: European High Purity Alumina Market Analysis (2012-2022) in Semiconductors by Geographic Region – France, Germany, Italy, Spain, United Kingdom and Rest of Europe in Tons .............................................................. 169 Chart 140: Glance at 2012, 2017 and 2022 European High Purity Alumina Volume Market Share (%) in Semiconductors by Geographic Region – France, Germany, Italy, Spain, United Kingdom and Rest of Europe .......... 170 2.3.1.1.4 Industrial & Other Applications............... 171 Chart 141: European High Purity Alumina Market Analysis (2012-2022) in Industrial & Other Applications by Geographic Region – France, Germany, Italy, Spain, United Kingdom and Rest of Europe in Tons ............................. 171 Chart 142: Glance at 2012, 2017 and 2022 European High Purity Alumina Volume Market Share (%) in Industrial & Other Applications by Geographic Region – France, Germany, Italy, Spain, United Kingdom and Rest of Europe .......................... 172 2.3.2 Market Analysis in USD ................................. 173 Chart 143: European High Purity Alumina Market Analysis (2012-2022) by Application – LEDs, Phosphor-Based, Semiconductors and Industrial & Other Applications in USD Million ................................................................... 173 Chart 144: Glance at 2012, 2017 and 2022 European High Purity Alumina Value Market Share (%) by Application – LEDs, Phosphor-Based, Semiconductors and Industrial & Other Applications ........................................................ 174 2.3.2.1 High Purity Alumina Application Value Market Overview by European Region ............................... 175 2.3.2.1.1 LEDs ........................................................ 175 Chart 145: European High Purity Alumina Market Analysis (2012-2022) in LEDs by Geographic Region – France, Germany, Italy, Spain, United Kingdom and Rest of Europe in USD Million ................................................................ 175 Chart 146: Glance at 2012, 2017 and 2022 European High Purity Alumina Value Market Share (%) in LEDs by Geographic Region – France, Germany, Italy, Spain, United Kingdom and Rest of Europe ......................................... 176 2.3.2.1.2 Phosphor-Based Applications ................. 177 Chart 147: European High Purity Alumina Market Analysis (2012-2022) in Phosphor-Based Applications by Geographic Region – France, Germany, Italy, Spain, United Kingdom and Rest of Europe in USD Million .................. 177 Chart 148: Glance at 2012, 2017 and 2022 European High Purity Alumina Value Market Share (%) in Phosphor-Based Applications by Geographic Region – France, Germany, Italy, Spain, United Kingdom and Rest of Europe .......... 178 2.3.2.1.3 Semiconductors ...................................... 179 Chart 149: European High Purity Alumina Market Analysis (2012-2022) in Semiconductors by Geographic Region – France, Germany, Italy, Spain, United Kingdom and Rest of Europe in USD Million ................................................... 179 Chart 150: Glance at 2012, 2017 and 2022 European High Purity Alumina Value Market Share (%) in Semiconductors by Geographic Region – France, Germany, Italy, Spain, United Kingdom and Rest of Europe.............................. 180 2.3.2.1.4 Industrial & Other Applications............... 181 Chart 151: European High Purity Alumina Market Analysis (2012-2022) in Industrial & Other Applications by Geographic Region – France, Germany, Italy, Spain, United Kingdom and Rest of Europe in USD Million .................. 181 Chart 152: Glance at 2012, 2017 and 2022 European High Purity Alumina Value Market Share (%) in Industrial & Other Applications by Geographic Region – France, Germany, Italy, Spain, United Kingdom and Rest of Europe ...................... 182 2.4 Major Market Players ...................................... 183 Baikowski Sas (France) .................................................. 183 Sasol Germany GmbH (Germany) ................................. 184 2.5 European High Purity Alumina Market Overview by Country ............................................................. 185 2.5.1 France ........................................................ 185 2.5.1.1 Market Overview by Product Segment ...... 185 2.5.1.1.1 Market Analysis in Tons .......................... 185 Chart 153: French High Purity Alumina Market Analysis (2012- 2022) by Product Segment – 4N, 5N and 6N in Tons ............ 185 Chart 154: Glance at 2012, 2017 and 2022 French High Purity Alumina Volume Market Share (%) by Product Segment – 4N, 5N and 6N ............................................. 186 2.5.1.1.2 Market Analysis in USD ........................... 187 Chart 155: French High Purity Alumina Market Analysis (2012-2022) by Product Segment – 4N, 5N and 6N in USD Million ........................................................................... 187 Chart 156: Glance at 2012, 2017 and 2022 French High Purity Alumina Value Market Share (%) by Product Segment – 4N, 5N and 6N ............................................. 188 2.5.1.2 Market Overview by Application ............... 189 2.5.1.2.1 Market Analysis in Tons .......................... 189 Chart 157: French High Purity Alumina Market Analysis (2012-2022) by Application – LEDs, Phosphor-Based, Semiconductors and Industrial & Other Applications in Tons .............................................................................. 189 Chart 158: Glance at 2012, 2017 and 2022 French High Purity Alumina Volume Market Share (%) by Application – LEDs, Phosphor-Based, Semiconductors and Industrial & Other Applications ........................................................ 190 2.5.1.2.2 Market Analysis in USD ........................... 191 Chart 159: French High Purity Alumina Market Analysis (2012-2022) by Application – LEDs, Phosphor-Based, Semiconductors and Industrial & Other Applications in USD Million ................................................................... 191 Chart 160: Glance at 2012, 2017 and 2022 French High Purity Alumina Value Market Share (%) by Application – LEDs, Phosphor-Based, Semiconductors and Industrial & Other Applications ........................................................ 192 2.5.2 Germany .................................................... 193 2.5.2.1 Market Overview by Product Segment ...... 193 2.5.2.1.1 Market Analysis in Tons .......................... 193 Chart 161: German High Purity Alumina Market Analysis (2012-2022) by Product Segment – 4N, 5N and 6N in Tons . 193 Chart 162: Glance at 2012, 2017 and 2022 German High Purity Alumina Volume Market Share (%) by Product Segment – 4N, 5N and 6N ............................................. 194 2.5.2.1.2 Market Analysis in USD ........................... 195 Chart 163: German High Purity Alumina Market Analysis (2012-2022) by Product Segment – 4N, 5N and 6N in USD Million ........................................................................... 195 Chart 164: Glance at 2012, 2017 and 2022 French High Purity Alumina Value Market Share (%) by Product Segment – 4N, 5N and 6N ............................................. 196 2.5.2.2 Market Overview by Application ............... 197 2.5.2.2.1 Market Analysis in Tons .......................... 197 Chart 165: German High Purity Alumina Market Analysis (2012-2022) by Application – LEDs, Phosphor-Based, Semiconductors and Industrial & Other Applications in Tons .............................................................................. 197 Chart 166: Glance at 2012, 2017 and 2022 German High Purity Alumina Volume Market Share (%) by Application – LEDs, Phosphor-Based, Semiconductors and Industrial & Other Applications ........................................................ 198 2.5.2.2.2 Market Analysis in USD ........................... 199 Chart 167: German High Purity Alumina Market Analysis (2012-2022) by Application – LEDs, Phosphor-Based, Semiconductors and Industrial & Other Applications in USD Million ................................................................... 199 Chart 168: Glance at 2012, 2017 and 2022 German High Purity Alumina Value Market Share (%) by Application – LEDs, Phosphor-Based, Semiconductors and Industrial & Other Applications ........................................................ 200 2.5.3 Italy ........................................................... 201 2.5.3.1 Market Overview by Product Segment ...... 201 2.5.3.1.1 Market Analysis in Tons .......................... 201 Chart 169: Italian High Purity Alumina Market Analysis (2012- 2022) by Product Segment – 4N, 5N and 6N in Tons ............ 201 Chart 170: Glance at 2012, 2017 and 2022 Italian High Purity Alumina Volume Market Share (%) by Product Segment – 4N, 5N and 6N............................................. 202 2.5.3.1.2 Market Analysis in USD ........................... 203 Chart 171: Italian High Purity Alumina Market Analysis (2012-2022) by Product Segment – 4N, 5N and 6N in USD Million .......................................................................... 203 Chart 172: Glance at 2012, 2017 and 2022 Italian High Purity Alumina Value Market Share (%) by Product Segment – 4N, 5N and 6N............................................. 204 2.5.3.2 Market Overview by Application ............... 205 2.5.3.2.1 Market Analysis in Tons .......................... 205 Chart 173: Italian High Purity Alumina Market Analysis (2012-2022) by Application – LEDs, Phosphor-Based, Semiconductors and Industrial & Other Applications in Tons .............................................................................. 205 Chart 174: Glance at 2012, 2017 and 2022 Italian High Purity Alumina Volume Market Share (%) by Application – LEDs, Phosphor-Based, Semiconductors and Industrial & Other Applications ........................................................ 206 2.5.3.2.2 Market Analysis in USD ........................... 207 Chart 175: Italian High Purity Alumina Market Analysis (2012-2022) by Application – LEDs, Phosphor-Based, Semiconductors and Industrial & Other Applications in USD Million ................................................................... 207 Chart 176: Glance at 2012, 2017 and 2022 Italian High Purity Alumina Value Market Share (%) by Application – LEDs, Phosphor-Based, Semiconductors and Industrial & Other Applications ........................................................ 208 2.5.4 Spain .......................................................... 209 2.5.4.1 Market Overview by Product Segment ...... 209 2.5.4.1.1 Market Analysis in Tons .......................... 209 Chart 177: Spanish High Purity Alumina Market Analysis (2012- 2022) by Product Segment – 4N, 5N and 6N in Tons ............ 209 Chart 178: Glance at 2012, 2017 and 2022 German High Purity Alumina Volume Market Share (%) by Product Segment – 4N, 5N and 6N............................................. 210 2.5.4.1.2 Market Analysis in USD ........................... 211 Chart 179: Spanish High Purity Alumina Market Analysis (2012-2022) by Product Segment – 4N, 5N and 6N in USD Million .......................................................................... 211 Chart 180: Glance at 2012, 2017 and 2022 Spanish High Purity Alumina Value Market Share (%) by Product Segment – 4N, 5N and 6N............................................. 212 2.5.4.2 Market Overview by Application ............... 213 2.5.4.2.1 Market Analysis in Tons .......................... 213 Chart 181: Spanish High Purity Alumina Market Analysis (2012-2022) by Application – LEDs, Phosphor-Based, Semiconductors and Industrial & Other Applications in Tons .............................................................................. 213 Chart 182: Glance at 2012, 2017 and 2022 Spanish High Purity Alumina Volume Market Share (%) by Application – LEDs, Phosphor-Based, Semiconductors and Industrial & Other Applications ........................................................ 214 2.5.4.2.2 Market Analysis in USD ........................... 215 Chart 183: Spanish High Purity Alumina Market Analysis (2012-2022) by Application – LEDs, Phosphor-Based, Semiconductors and Industrial & Other Applications in USD Million ................................................................... 215 Chart 184: Glance at 2012, 2017 and 2022 Spanish High Purity Alumina Value Market Share (%) by Application – LEDs, Phosphor-Based, Semiconductors and Industrial & Other Applications ........................................................ 216 2.5.5 The United Kingdom ................................... 217 2.5.5.1 Market Overview by Product Segment ...... 217 2.5.5.1.1 Market Analysis in Tons .......................... 217 Chart 185: United Kingdom High Purity Alumina Market Analysis (2012-2022) by Product Segment – 4N, 5N and 6N in Tons .......................................................................... 217 Chart 186: Glance at 2012, 2017 and 2022 United Kingdom High Purity Alumina Volume Market Share (%) by Product Segment – 4N, 5N and 6N............................................. 218 2.5.5.1.2 Market Analysis in USD ........................... 219 Click here to buy the report Page 6
High Purity Alumina – A Global Market Overview Mar 2016 |336 Pages | 289 Charts | Price $4050 Chart 187: United Kingdom High Purity Alumina Market Analysis (2012-2022) by Product Segment – 4N, 5N and 6N in USD Million ................................................................ 219 Chart 188: Glance at 2012, 2017 and 2022 United Kingdom High Purity Alumina Value Market Share (%) by Product Segment – 4N, 5N and 6N ............................................. 220 2.5.5.2 Market Overview by Application ............... 221 2.5.5.2.1 Market Analysis in Tons .......................... 221 Chart 189: United Kingdom High Purity Alumina Market Analysis (2012-2022) by Application – LEDs, Phosphor- Based, Semiconductors and Industrial & Other Applications in Tons ...................................................... 221 Chart 190: Glance at 2012, 2017 and 2022 United Kingdom High Purity Alumina Volume Market Share (%) by Application – LEDs, Phosphor-Based, Semiconductors and Industrial & Other Applications ..................................... 222 2.5.5.2.2 Market Analysis in USD ........................... 223 Chart 191: United Kingdom High Purity Alumina Market Analysis (2012-2022) by Application – LEDs, Phosphor- Based, Semiconductors and Industrial & Other Applications in USD Million ........................................... 223 Chart 192: Glance at 2012, 2017 and 2022 United Kingdom High Purity Alumina Value Market Share (%) by Application – LEDs, Phosphor-Based, Semiconductors and Industrial & Other Applications ..................................... 224 2.5.6 Rest of Europe ........................................... 225 2.5.6.1 Market Overview by Product Segment ...... 225 2.5.6.1.1 Market Analysis in Tons .......................... 225 Chart 193: Rest of Europe High Purity Alumina Market Analysis (2012-2022) by Product Segment – 4N, 5N and 6N in Tons ........................................................................... 225 Chart 194: Glance at 2012, 2017 and 2022 Rest of Europe High Purity Alumina Volume Market Share (%) by Product Segment – 4N, 5N and 6N ............................................. 226 2.5.6.1.2 Market Analysis in USD ........................... 227 Chart 195: Rest of Europe High Purity Alumina Market Analysis (2012-2022) by Product Segment – 4N, 5N and 6N in USD Million ................................................................ 227 Chart 196: Glance at 2012, 2017 and 2022 Rest of Europe High Purity Alumina Value Market Share (%) by Product Segment – 4N, 5N and 6N ............................................. 228 2.5.6.2 Market Overview by Application ............... 229 2.5.6.2.1 Market Analysis in Tons .......................... 229 Chart 197: Rest of Europe High Purity Alumina Market Analysis (2012-2022) by Application – LEDs, Phosphor- Based, Semiconductors and Industrial & Other Applications in Tons ...................................................... 229 Chart 198: Glance at 2012, 2017 and 2022 Rest of Europe High Purity Alumina Volume Market Share (%) by Application – LEDs, Phosphor-Based, Semiconductors and Industrial & Other Applications ..................................... 230 2.5.6.2.2 Market Analysis in USD ........................... 231 Chart 199: Rest of Europe High Purity Alumina Market Analysis (2012-2022) by Application – LEDs, Phosphor- Based, Semiconductors and Industrial & Other Applications in USD Million ........................................... 231 Chart 200: Glance at 2012, 2017 and 2022 Rest of Europe High Purity Alumina Value Market Share (%) by Application – LEDs, Phosphor-Based, Semiconductors and Industrial & Other Applications ..................................... 232 Chart 204: Asia-Pacific High Purity Alumina Market Analysis (2012-2022) by Geographic Region – China, Japan, South Korea, Taiwan and Rest of Asia-Pacific in USD Million ........................................................................... 236 Chart 205: Glance at 2012, 2017 and 2022 Asia-Pacific High Purity Alumina Value Market Share (%) by Geographic Region – China, Japan, South Korea, Taiwan and Rest of Asia-Pacific ................................................. 237 3.2 Asia-Pacific High Purity Alumina Market Overview by Product Segment .............................................. 238 3.2.1 Market Analysis in Tons ................................ 238 Chart 206: Asia-Pacific High Purity Alumina Market Analysis (2012-2022) by Product Segment – 4N, 5N and 6N in Tons .......................................................................... 238 Chart 207: Glance at 2012, 2017 and 2022 Asia-Pacific High Purity Alumina Volume Market Share (%) by Product Segment – 4N, 5N and 6N ............................................. 239 3.2.1.1 High Purity Alumina Product Segment Volume Market Overview by Asia-Pacific Region ............... 240 3.2.1.1.1 4N High Purity Alumina ........................... 240 Chart 208: Asia-Pacific 4N High Purity Alumina Market Analysis (2012-2022) by Geographic Region – China, Japan, South Korea, Taiwan and Rest of Asia-Pacific in Tons .............................................................................. 240 Chart 209: Glance at 2012, 2017 and 2022 4N Asia-Pacific High Purity Alumina Volume Market Share (%) by Geographic Region – China, Japan, South Korea, Taiwan and Rest of Asia-Pacific ................................................. 241 3.2.1.1.2 5N High Purity Alumina ........................... 242 Chart 210: Asia-Pacific 5N High Purity Alumina Market Analysis (2012-2022) by Geographic Region – China, Japan, South Korea, Taiwan and Rest of Asia-Pacific in Tons .............................................................................. 242 Chart 211: Glance at 2012, 2017 and 2022 5N Asia-Pacific High Purity Alumina Volume Market Share (%) by Geographic Region – China, Japan, South Korea, Taiwan and Rest of Asia-Pacific ................................................. 243 3.2.1.1.3 6N High Purity Alumina ........................... 244 Chart 212: Asia-Pacific 6N High Purity Alumina Market Analysis (2012-2022) by Geographic Region – China, Japan, South Korea, Taiwan and Rest of Asia-Pacific in Tons .............................................................................. 244 Chart 213: Glance at 2012, 2017 and 2022 6N Asia-Pacific High Purity Alumina Volume Market Share (%) by Geographic Region – China, Japan, South Korea, Taiwan and Rest of Asia-Pacific ................................................. 245 3.2.2 Market Analysis in USD ................................. 246 Chart 214: Asia-Pacific High Purity Alumina Market Analysis (2012-2022) by Product Segment – 4N, 5N and 6N in USD Million ............................................................... 246 Chart 215: Glance at 2012, 2017 and 2022 Asia-Pacific High Purity Alumina Value Market Share (%) by Product Segment – 4N, 5N and 6N ............................................. 247 3.2.2.1 High Purity Alumina Product Segment Value Market Overview by Asia-Pacific Region ............... 248 3.2.2.1.1 4N High Purity Alumina ........................... 248 Chart 216: Asia-Pacific 4N High Purity Alumina Market Analysis (2012-2022) by Geographic Region – China, Japan, South Korea, Taiwan and Rest of Asia-Pacific in USD Million .......... 248 Chart 217: Glance at 2012, 2017 and 2022 Asia-Pacific 4N High Purity Alumina Value Market Share (%) by Geographic Region – China, Japan, South Korea, Taiwan and Rest of Asia-Pacific ................................................. 249 3.2.2.1.2 5N High Purity Alumina ........................... 250 Chart 218: Asia-Pacific 5N High Purity Alumina Market Analysis (2012-2022) by Geographic Region – China, Japan, South Korea, Taiwan and Rest of Asia-Pacific in USD Million ........................................................................... 250 Chart 219: Glance at 2012, 2017 and 2022 Asia-Pacific 5N High Purity Alumina Value Market Share (%) by Geographic Region – China, Japan, South Korea, Taiwan and Rest of Asia-Pacific ................................................. 251 3.2.2.1.3 6N High Purity Alumina ........................... 252 Chart 220: Asia-Pacific 6N High Purity Alumina Market Analysis (2012-2022) by Geographic Region – China, Japan, South Korea, Taiwan and Rest of Asia-Pacific in USD Million ........................................................................... 252 Chart 221: Glance at 2012, 2017 and 2022 Asia-Pacific 6N High Purity Alumina Value Market Share (%) by Geographic Region – China, Japan, South Korea, Taiwan and Rest of Asia-Pacific ................................................. 253 3.3 Asia-Pacific High Purity Alumina Market Overview by Application ........................................................ 254 3.3.1 Market Analysis in Tons ................................ 254 Chart 222: Asia-Pacific High Purity Alumina Market Analysis (2012-2022) by Application – LEDs, Phosphor- Based, Semiconductors and Industrial & Other Applications in Tons...................................................... 254 Chart 223: Glance at 2012, 2017 and 2022 Asia-Pacific High Purity Alumina Volume Market Share (%) by Application – LEDs, Phosphor-Based, Semiconductors and Industrial & Other Applications .................................... 255 3.3.1.1 High Purity Alumina Application Volume Market Overview by Asia-Pacific Region ............... 256 3.3.1.1.1 LEDs ........................................................ 256 Chart 224: Asia-Pacific High Purity Alumina Market Analysis (2012-2022) in LEDs by Geographic Region – China, Japan, South Korea, Taiwan and Rest of Asia-Pacific in Tons .......................................................................... 256 Chart 225: Glance at 2012, 2017 and 2022 Asia-Pacific High Purity Alumina Volume Market Share (%) in LEDs by Geographic Region – China, Japan, South Korea, Taiwan and Rest of Asia-Pacific ................................................. 257 3.3.1.1.2 Phosphor-Based Applications ................. 258 Chart 226: Asia-Pacific High Purity Alumina Market Analysis (2012-2022) in Phosphor-Based Applications by Geographic Region – China, Japan, South Korea, Taiwan and Rest of Asia-Pacific in Tons .................................... 258 Chart 227: Glance at 2012, 2017 and 2022 Asia-Pacific High Purity Alumina Volume Market Share (%) in Phosphor-Based Applications by Geographic Region – China, Japan, South Korea, Taiwan and Rest of Asia-Pacific .............................. 259 3.3.1.1.3 Semiconductors ...................................... 260 Chart 228: Asia-Pacific High Purity Alumina Market Analysis (2012-2022) in Semiconductors by Geographic Region – China, Japan, South Korea, Taiwan and Rest of Asia-Pacific in Tons ....................................................... 260 Chart 229: Glance at 2012, 2017 and 2022 Asia-Pacific High Purity Alumina Volume Market Share (%) in Semiconductors by Geographic Region – China, Japan, South Korea, Taiwan and Rest of Asia-Pacific ............... 261 3.3.1.1.4 Industrial & Other Applications .............. 262 Chart 230: Asia-Pacific High Purity Alumina Market Analysis (2012-2022) in Industrial & Other Applications by Geographic Region – China, Japan, South Korea, Taiwan and Rest of Asia-Pacific in Tons .................................... 262 Chart 231: Glance at 2012, 2017 and 2022 Asia-Pacific High Purity Alumina Volume Market Share (%) in Industrial & Other Applications by Geographic Region – China, Japan, South Korea, Taiwan and Rest of Asia-Pacific .... 263 3.3.2 Market Analysis in USD ................................. 264 Chart 232: Asia-Pacific High Purity Alumina Market Analysis (2012-2022) by Application – LEDs, Phosphor- Based, Semiconductors and Industrial & Other Applications in USD Million .......................................... 264 Chart 233: Glance at 2012, 2017 and 2022 Asia-Pacific High Purity Alumina Value Market Share (%) by Application – LEDs, Phosphor-Based, Semiconductors and Industrial & Other Applications .................................... 265 3.3.2.1 High Purity Alumina Application Value Market Overview by Asia-Pacific Region ............................ 266 3.3.2.1.1 LEDs ........................................................ 266 Chart 234: Asia-Pacific High Purity Alumina Market Analysis (2012-2022) in LEDs by Geographic Region – China, Japan, South Korea, Taiwan and Rest of Asia-Pacific in USD Million ............... 266 Chart 235: Glance at 2012, 2017 and 2022 Asia-Pacific High Purity Alumina Value Market Share (%) in LEDs by Geographic Region – China, Japan, South Korea, Taiwan and Rest of Asia-Pacific ................................................. 267 3.3.2.1.2 Phosphor-Based Applications ................. 268 Chart 236: Asia-Pacific High Purity Alumina Market Analysis (2012-2022) in Phosphor-Based Applications by Geographic Region – China, Japan, South Korea, Taiwan and Rest of Asia-Pacific in USD Million ......................... 268 3. ASIA-PACIFIC................................................... 233 Chart 201: Asia-Pacific High Purity Alumina Market Overview (2012-2022) in Volume (Tons) and Value (USD Million) .......................................................................... 233 3.1 Asia-Pacific High Purity Alumina Market Overview by Geographic Region ............................................ 234 3.1.1 Market Analysis in Tons ................................ 234 Chart 202: Asia-Pacific High Purity Alumina Market Analysis (2012-2022) by Geographic Region – China, Japan, South Korea, Taiwan and Rest of Asia-Pacific in Tons............................................................................... 234 Chart 203: Glance at 2012, 2017 and 2022 Asia-Pacific High Purity Alumina Volume Market Share (%) by Geographic Region – China, Japan, South Korea, Taiwan and Rest of Asia-Pacific ................................................. 235 3.1.2 Market Analysis in USD ................................. 236 Click here to buy the report Page 7
High Purity Alumina – A Global Market Overview Mar 2016 |336 Pages | 289 Charts | Price $4050 Chart 237: Glance at 2012, 2017 and 2022 Asia-Pacific High Purity Alumina Value Market Share (%) in Phosphor- Based Applications by Geographic Region – China, Japan, South Korea, Taiwan and Rest of Asia-Pacific ................ 269 3.3.2.1.3 Semiconductors ...................................... 270 Chart 238: Asia-Pacific High Purity Alumina Market Analysis (2012-2022) in Semiconductors by Geographic Region – China, Japan, South Korea, Taiwan and Rest of Asia-Pacific in USD Million ............................................. 270 Chart 239: Glance at 2012, 2017 and 2022 Asia-Pacific High Purity Alumina Value Market Share (%) in Semiconductors by Geographic Region – China, Japan, South Korea, Taiwan and Rest of Asia-Pacific ................ 271 3.3.2.1.4 Industrial & Other Applications............... 272 Chart 240: Asia-Pacific High Purity Alumina Market Analysis (2012-2022) in Industrial & Other Applications by Geographic Region – China, Japan, South Korea, Taiwan and Rest of Asia-Pacific in USD Million .......................... 272 Chart 241: Glance at 2012, 2017 and 2022 Asia-Pacific High Purity Alumina Value Market Share (%) in Industrial & Other Applications by Geographic Region – China, Japan, South Korea, Taiwan and Rest of Asia-Pacific ................ 273 3.4 Major Market Players ...................................... 274 Airy Technology Co Ltd (China) ...................................... 274 Altech Chemicals Ltd (Australia) .................................... 274 Dalian Hiland Photoelectric Material Co Ltd (China) ...... 275 Hmr Co Ltd (South Korea) .............................................. 276 Nippon Light Metal Co Ltd (Japan)................................. 277 PhiChem Corporation (China) ........................................ 278 Sumitomo Chemical Co Ltd (Japan) ............................... 279 Taimei Chemicals Co Ltd (Japan) ................................... 279 Xuancheng Jingrui New Materials Co Ltd (China) .......... 280 Zibo Honghe Chemical Co Ltd (China) ............................ 280 Zibo Xinfumeng Chemicals Co Ltd (China) ..................... 281 Zibo Xinmeiyu Alumina Co Ltd (China) ........................... 282 3.5 Asia-Pacific High Purity Alumina Market Overview by Country ............................................................. 283 3.5.1 China ......................................................... 283 3.5.1.1 Market Overview by Product Segment ...... 283 3.5.1.1.1 Market Analysis in Tons .......................... 283 Chart 242: Chinese High Purity Alumina Market Analysis (2012- 2022) by Product Segment – 4N, 5N and 6N in Tons ............ 283 Chart 243: Glance at 2012, 2017 and 2022 Chinese High Purity Alumina Volume Market Share (%) by Product Segment – 4N, 5N and 6N ............................................. 284 3.5.1.1.2 Market Analysis in USD ........................... 285 Chart 244: Chinese High Purity Alumina Market Analysis (2012-2022) by Product Segment – 4N, 5N and 6N in USD Million ........................................................................... 285 Chart 245: Glance at 2012, 2017 and 2022 Chinese High Purity Alumina Value Market Share (%) by Product Segment – 4N, 5N and 6N ............................................. 286 3.5.1.2 Market Overview by Application ............... 287 3.5.1.2.1 Market Analysis in Tons .......................... 287 Chart 246: Chinese High Purity Alumina Market Analysis (2012-2022) by Application – LEDs, Phosphor-Based, Semiconductors and Industrial & Other Applications in Tons............................................................................... 287 Chart 247: Glance at 2012, 2017 and 2022 Chinese High Purity Alumina Volume Market Share (%) by Application – LEDs, Phosphor-Based, Semiconductors and Industrial & Other Applications ........................................................ 288 3.5.1.2.2 Market Analysis in USD ........................... 289 Chart 248: Chinese High Purity Alumina Market Analysis (2012-2022) by Application – LEDs, Phosphor-Based, Semiconductors and Industrial & Other Applications in USD Million ................................................................... 289 Chart 249: Glance at 2012, 2017 and 2022 Chinese High Purity Alumina Value Market Share (%) by Application – LEDs, Phosphor-Based, Semiconductors and Industrial & Other Applications ........................................................ 290 3.5.2 Japan ......................................................... 291 3.5.2.1 Market Overview by Product Segment ...... 291 3.5.2.1.1 Market Analysis in Tons .......................... 291 Chart 250: Japanese High Purity Alumina Market Analysis (2012-2022) by Product Segment – 4N, 5N and 6N in Tons . 291 Chart 251: Glance at 2012, 2017 and 2022 Japanese High Purity Alumina Volume Market Share (%) by Product Segment – 4N, 5N and 6N ............................................. 292 3.5.2.1.2 Market Analysis in USD ........................... 293 Chart 252: Japanese High Purity Alumina Market Analysis (2012-2022) by Product Segment – 4N, 5N and 6N in USD Million ........................................................................... 293 Chart 253: Glance at 2012, 2017 and 2022 Japanese High Purity Alumina Value Market Share (%) by Product Segment – 4N, 5N and 6N ............................................. 294 3.5.2.2 Market Overview by Application ............... 295 3.5.2.2.1 Market Analysis in Tons .......................... 295 Chart 254: Japanese High Purity Alumina Market Analysis (2012- 2022) by Application – LEDs, Phosphor-Based, Semiconductors and Industrial & Other Applications in Tons............................... 295 Chart 255: Glance at 2012, 2017 and 2022 Japanese High Purity Alumina Volume Market Share (%) by Application – LEDs, Phosphor-Based, Semiconductors and Industrial & Other Applications ........................................................ 296 3.5.2.2.2 Market Analysis in USD ........................... 297 Chart 256: Japanese High Purity Alumina Market Analysis (2012-2022) by Application – LEDs, Phosphor-Based, Semiconductors and Industrial & Other Applications in USD Million ................................................................... 297 Chart 257: Glance at 2012, 2017 and 2022 Japanese High Purity Alumina Value Market Share (%) by Application – LEDs, Phosphor-Based, Semiconductors and Industrial & Other Applications ........................................................ 298 3.5.3 South Korea ............................................... 299 3.5.3.1 Market Overview by Product Segment ...... 299 3.5.3.1.1 Market Analysis in Tons .......................... 299 Chart 258: South Korean High Purity Alumina Market Analysis (2012-2022) by Product Segment – 4N, 5N and 6N in Tons .......................................................................... 299 Chart 259: Glance at 2012, 2017 and 2022 South Korean High Purity Alumina Volume Market Share (%) by Product Segment – 4N, 5N and 6N ............................................. 300 3.5.3.1.2 Market Analysis in USD ........................... 301 Chart 260: South Korean High Purity Alumina Market Analysis (2012-2022) by Product Segment – 4N, 5N and 6N in USD Million ............................................................... 301 Chart 261: Glance at 2012, 2017 and 2022 South Korean High Purity Alumina Value Market Share (%) by Product Segment – 4N, 5N and 6N ............................................. 302 3.5.3.2 Market Overview by Application ............... 303 3.5.3.2.1 Market Analysis in Tons .......................... 303 Chart 262: South Korean High Purity Alumina Market Analysis (2012-2022) by Application – LEDs, Phosphor- Based, Semiconductors and Industrial & Other Applications in Tons ...................................................... 303 Chart 263: Glance at 2012, 2017 and 2022 South Korean High Purity Alumina Volume Market Share (%) by Application – LEDs, Phosphor-Based, Semiconductors and Industrial & Other Applications ..................................... 304 3.5.3.2.2 Market Analysis in USD ........................... 305 Chart 264: South Korean High Purity Alumina Market Analysis (2012-2022) by Application – LEDs, Phosphor- Based, Semiconductors and Industrial & Other Applications in USD Million ........................................... 305 Chart 265: Glance at 2012, 2017 and 2022 South Korean High Purity Alumina Value Market Share (%) by Application – LEDs, Phosphor-Based, Semiconductors and Industrial & Other Applications ..................................... 306 3.5.4 Taiwan ....................................................... 307 3.5.4.1 Market Overview by Product Segment ...... 307 3.5.4.1.1 Market Analysis in Tons .......................... 307 Chart 266: Taiwanese High Purity Alumina Market Analysis (2012-2022) by Product Segment – 4N, 5N and 6N in Tons . 307 Chart 267: Glance at 2012, 2017 and 2022 Taiwanese High Purity Alumina Volume Market Share (%) by Product Segment – 4N, 5N and 6N ............................................. 308 3.5.4.1.2 Market Analysis in USD ........................... 309 Chart 268: Taiwanese High Purity Alumina Market Analysis (2012-2022) by Product Segment – 4N, 5N and 6N in USD Million ........................................................................... 309 Chart 269: Glance at 2012, 2017 and 2022 Taiwanese High Purity Alumina Value Market Share (%) by Product Segment – 4N, 5N and 6N............................................. 310 3.5.4.2 Market Overview by Application ............... 311 3.5.4.2.1 Market Analysis in Tons .......................... 311 Chart 270: Taiwanese High Purity Alumina Market Analysis (2012-2022) by Application – LEDs, Phosphor-Based, Semiconductors and Industrial & Other Applications in Tons .............................................................................. 311 Chart 271: Glance at 2012, 2017 and 2022 Taiwanese High Purity Alumina Volume Market Share (%) by Application – LEDs, Phosphor-Based, Semiconductors and Industrial & Other Applications ........................................................ 312 3.5.4.2.2 Market Analysis in USD ........................... 313 Chart 272: Taiwanese High Purity Alumina Market Analysis (2012-2022) by Application – LEDs, Phosphor-Based, Semiconductors and Industrial & Other Applications in USD Million ................................................................... 313 Chart 273: Glance at 2012, 2017 and 2022 Taiwanese High Purity Alumina Value Market Share (%) by Application – LEDs, Phosphor-Based, Semiconductors and Industrial & Other Applications ........................................................ 314 3.5.5 Rest of Asia-Pacific ..................................... 315 3.5.5.1 Market Overview by Product Segment ...... 315 3.5.5.1.1 Market Analysis in Tons .......................... 315 Chart 274: Rest of Asia-Pacific High Purity Alumina Market Analysis (2012-2022) by Product Segment – 4N, 5N and 6N in Tons .......................................................................... 315 Chart 275: Glance at 2012, 2017 and 2022 Rest of Asia- Pacific High Purity Alumina Volume Market Share (%) by Product Segment – 4N, 5N and 6N ............................... 316 3.5.5.1.2 Market Analysis in USD ........................... 317 Chart 276: Rest of Asia-Pacific High Purity Alumina Market Analysis (2012-2022) by Product Segment – 4N, 5N and 6N in USD Million ............................................................... 317 Chart 277: Glance at 2012, 2017 and 2022 Rest of Asia- Pacific High Purity Alumina Value Market Share (%) by Product Segment – 4N, 5N and 6N ............................... 318 3.5.5.2 Market Overview by Application ............... 319 3.5.5.2.1 Market Analysis in Tons .......................... 319 Chart 278: Rest of Asia-Pacific High Purity Alumina Market Analysis (2012-2022) by Application – LEDs, Phosphor- Based, Semiconductors and Industrial & Other Applications in Tons...................................................... 319 Chart 279: Glance at 2012, 2017 and 2022 Rest of Asia- Pacific High Purity Alumina Volume Market Share (%) by Application – LEDs, Phosphor-Based, Semiconductors and Industrial & Other Applications .................................... 320 3.5.5.2.2 Market Analysis in USD ........................... 321 Chart 280: Rest of Asia-Pacific High Purity Alumina Market Analysis (2012-2022) by Application – LEDs, Phosphor- Based, Semiconductors and Industrial & Other Applications in USD Million .......................................... 321 Chart 281: Glance at 2012, 2017 and 2022 Rest of Asia- Pacific High Purity Alumina Value Market Share (%) by Application – LEDs, Phosphor-Based, Semiconductors and Industrial & Other Applications .................................... 322 4. REST OF WORLD .............................................. 323 4.1 Market Overview by Product Segment ............ 323 4.1.1 Market Analysis in Tons ................................ 323 Chart 282: Rest of World High Purity Alumina Market Analysis (2012-2022) by Product Segment – 4N, 5N and 6N in Tons .......................................................................... 323 Chart 283: Glance at 2012, 2017 and 2022 Rest of World High Purity Alumina Volume Market Share (%) by Product Segment – 4N, 5N and 6N............................................. 324 4.1.2 Market Analysis in USD ................................. 325 Chart 284: Rest of World High Purity Alumina Market Analysis (2012-2022) by Product Segment – 4N, 5N and 6N in USD Million ............................................................... 325 Chart 285: Glance at 2012, 2017 and 2022 Rest of World High Purity Alumina Value Market Share (%) by Product Segment – 4N, 5N and 6N............................................. 326 4.2 Market Overview by Application ..................... 327 Click here to buy the report Page 8
High Purity Alumina – A Global Market Overview Mar 2016 |336 Pages | 289 Charts | Price $4050 4.2.1 Market Analysis in Tons ................................ 327 Chart 286: Rest of World High Purity Alumina Market Analysis (2012-2022) by Application – LEDs, Phosphor- Based, Semiconductors and Industrial & Other Applications in Tons ...................................................... 327 Chart 287: Glance at 2012, 2017 and 2022 Rest of World High Purity Alumina Volume Market Share (%) by Application – LEDs, Phosphor-Based, Semiconductors and Industrial & Other Applications ..................................... 328 4.2.2 Market Analysis in USD ................................. 329 Chart 288: Rest of World High Purity Alumina Market Analysis (2012-2022) by Application – LEDs, Phosphor- Based, Semiconductors and Industrial & Other Applications in USD Million ........................................... 329 Chart 289: Glance at 2012, 2017 and 2022 Rest of World High Purity Alumina Value Market Share (%) by Application – LEDs, Phosphor-Based, Semiconductors and Industrial & Other Applications ..................................... 330 PART C: GUIDE TO THE INDUSTRY ............... 331 1. NORTH AMERICA ........................................................ 331 2. EUROPE ....................................................................... 331 3. ASIA-PACIFIC ............................................................... 332 4. REST OF WORLD .......................................................... 334 PART D: ANNEXURE .................................... 335 1. RESEARCH METHODOLOGY ......................................... 335 2. FEEDBACK ................................................................... 337 INDUSTRY EXPERTS 1-7-19/C, Street No. 8, Habsiguda Hyderabad – 500007, India Phone: +91-40-4018-1314 Fax: +91-40-4027-2381 info@industry-experts.com industry-experts.com About Industry Experts Industry Experts values the most updated and accurate market research and industry analysis to provide unique market research reports for a broad range of industry verticals including Automotive, Transportation, Healthcare, Pharmaceuticals, Food & Beverages, Chemicals, Plastics, Materials, Consumer Goods, Retail, Biotechnology, Construction, Manufacturing and Other industries. Our research reports help our clients to identify and resolve topical issues by providing a complete picture of the market in their respective industry sectors. The Company’s rich collection of market research reports enable the companies to explore market drivers; forecast the future market; and to formulate the right strategies at the right time. Industry Experts’ leading edge publications makes the life easy for corporate strategists, investors, analysts and researchers, start ups, consultants, financial and banking executives, academicians and many more. The company also provides customized research reports to cater the needs of the industry. More about Industry Experts Click here to buy the report Page 9