Download
1 / 8
90 likes | 156 Views
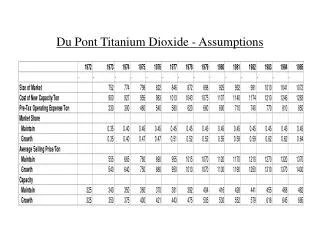
Stringent automobile emission control norms worldwide and concerns regarding fuel efficiency have compelled manufacturers to take measures for reducing vehicle weight considerably, thereby propelling demand for lightweight vehicles. One method of reducing vehicle weight is incorporating polycarbonates as replacement for part of the steel structures used in auto manufacturing. However, polycarbonates suffer from some drawbacks, such as low scratch resistance, which brings titanium dioxide into play. This material is used for coating polycarbonate structures that are further utilized in the auto manufacturing process. Using polycarbonates enables in reducing the weight of a vehicle and consequently enhancing fuel efficiency. Other applications of titanium dioxide in plastics include improving color, strength and opacity.

E N D
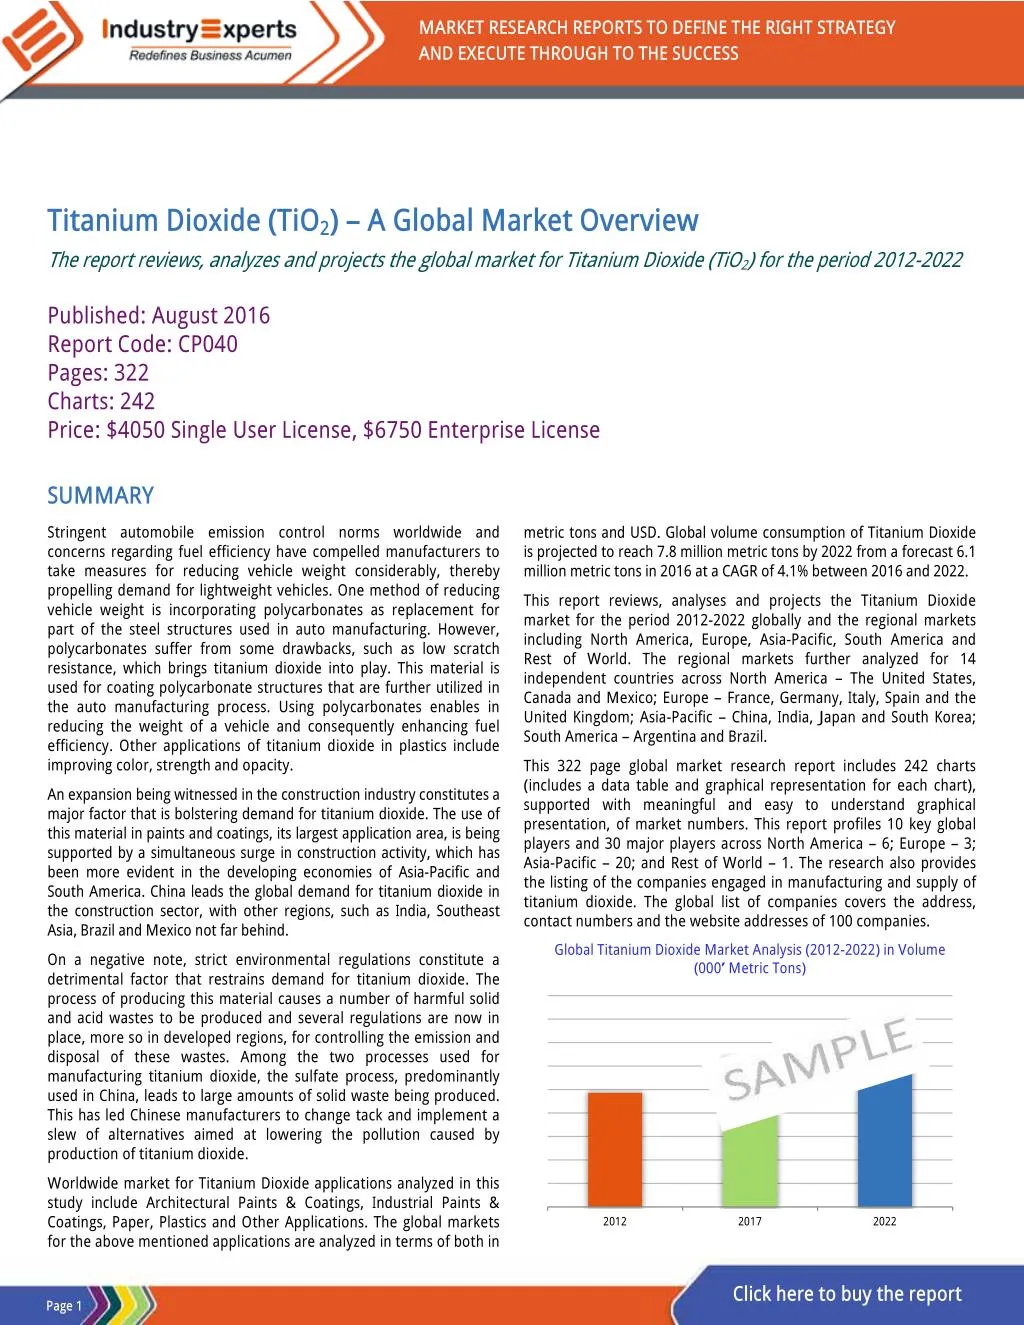
MARKET RESEARCH REPORTS TO DEFINE THE RIGHT STRATEGY AND EXECUTE THROUGH TO THE SUCCESS Titanium Dioxide (TiO2) – A Global Market Overview The report reviews, analyzes and projects the global market for Titanium Dioxide (TiO2) for the period 2012-2022 Published: August 2016 Report Code: CP040 Pages: 322 Charts: 242 Price: $4050 Single User License, $6750 Enterprise License SUMMARY Stringent automobile emission control norms worldwide and concerns regarding fuel efficiency have compelled manufacturers to take measures for reducing vehicle weight considerably, thereby propelling demand for lightweight vehicles. One method of reducing vehicle weight is incorporating polycarbonates as replacement for part of the steel structures used in auto manufacturing. However, polycarbonates suffer from some drawbacks, such as low scratch resistance, which brings titanium dioxide into play. This material is used for coating polycarbonate structures that are further utilized in the auto manufacturing process. Using polycarbonates enables in reducing the weight of a vehicle and consequently enhancing fuel efficiency. Other applications of titanium dioxide in plastics include improving color, strength and opacity. metric tons and USD. Global volume consumption of Titanium Dioxide is projected to reach 7.8 million metric tons by 2022 from a forecast 6.1 million metric tons in 2016 at a CAGR of 4.1% between 2016 and 2022. This report reviews, analyses and projects the Titanium Dioxide market for the period 2012-2022 globally and the regional markets including North America, Europe, Asia-Pacific, South America and Rest of World. The regional markets further analyzed for 14 independent countries across North America – The United States, Canada and Mexico; Europe – France, Germany, Italy, Spain and the United Kingdom; Asia-Pacific – China, India, Japan and South Korea; South America – Argentina and Brazil. This 322 page global market research report includes 242 charts (includes a data table and graphical representation for each chart), supported with meaningful and easy to understand graphical presentation, of market numbers. This report profiles 10 key global players and 30 major players across North America – 6; Europe – 3; Asia-Pacific – 20; and Rest of World – 1. The research also provides the listing of the companies engaged in manufacturing and supply of titanium dioxide. The global list of companies covers the address, contact numbers and the website addresses of 100 companies. An expansion being witnessed in the construction industry constitutes a major factor that is bolstering demand for titanium dioxide. The use of this material in paints and coatings, its largest application area, is being supported by a simultaneous surge in construction activity, which has been more evident in the developing economies of Asia-Pacific and South America. China leads the global demand for titanium dioxide in the construction sector, with other regions, such as India, Southeast Asia, Brazil and Mexico not far behind. Global Titanium Dioxide Market Analysis (2012-2022) in Volume (000’ Metric Tons) On a negative note, strict environmental regulations constitute a detrimental factor that restrains demand for titanium dioxide. The process of producing this material causes a number of harmful solid and acid wastes to be produced and several regulations are now in place, more so in developed regions, for controlling the emission and disposal of these wastes. Among the two processes used for manufacturing titanium dioxide, the sulfate process, predominantly used in China, leads to large amounts of solid waste being produced. This has led Chinese manufacturers to change tack and implement a slew of alternatives aimed at lowering the pollution caused by production of titanium dioxide. Worldwide market for Titanium Dioxide applications analyzed in this study include Architectural Paints & Coatings, Industrial Paints & Coatings, Paper, Plastics and Other Applications. The global markets for the above mentioned applications are analyzed in terms of both in 2012 2017 2022 Click here to buy the report Page 1
Titanium Dioxide (TiO2) – A Global Market Overview August 2016 |322 Pages | 242 Charts | Price $4050 SAMPLE TABLE/CHART Glance at 2017 Global Titanium Dioxide Volume Market Share (%) by Geographic Region – North America, Europe, Asia-Pacific, South America and Rest of World SAMPLE COMPANY PROFILE THE NATIONAL TITANIUM DIOXIDE COMPANY LIMITED (CRISTAL) (SAUDI ARABIA) Malik Road, King's Road Tower, King Abdulaziz Road, 16th Floor P.O. Box 13586 Jeddah 21414 Kingdom of Saudi Arabia Phone: 966.12.224.8000, Fax: 966.12.606.9087 Email: info@cristal.com Website: www.cristal.com Business Profile The National Titanium Dioxide Company Limited (Cristal) based in Jeddah, Saudi Arabia ranks among the largest manufacturers of titanium dioxide in the world. The company is also a leading manufacturer of titanium chemicals, mineral sands, and titanium metal powder; and a global leading supplier of ultrafine titanium dioxide products and titanium chemicals. The company is engaged in the manufacture and supply of titanium dioxide (TiO2), titanium chemicals, mineral sands, and titanium metal powder to various industries including paint, paper, plastics, and ink. Besides headquarters, the company has manufacturing locations in Ashtabula, Ohio; Baltimore, Maryland; Salvador, Bahia; Stallingborough, UK; Thann, France; Yanbu, Saudi Arabia; and Bunbury, Australia; and a mine site in Paraiba, Brazil as well. North American Titanium Dioxide Market Analysis (2012-2022) by Application – Architectural Paints & Coatings, Industrial Paints & Coatings, Paper, Plastics and Other Applications in 000’ Metric Tons Product Portfolio Cristal's titanium business offers pigments, comprising titanium dioxide (TiO2), CristalACTiV™ specialty titanium dioxides (Ultrafine TiO2), titanium tetrachloride (TiCl4) and related products; mining, including leucoxene, rutile, zircon, and ilmenite; metals, such as CP (Commercially Pure) titanium powder, and Ti 6-4 alloy (6% Aluminum/ 4% Vanadium); and chemicals, covering carbon dioxide, caustic flake, caustic soda, chlorine, copperas, gypsum, hydrochloric acid, hydrogen, hypochlorite, iron chlorosulfate, molten sulfur, sodium silicate, and sulfuric acid. performance chemicals, 2012 2017 2022 KEY PLAYERS PROFILED •CNNC Hua Yuan Titanium Dioxide Co., Ltd. •Evonik Industries AG •Guangdong Huiyun Titanium Industry Corporation Limited •Henan Billions Chemicals Co., Ltd. •Huntsman International LLC •Jiangsu Taibai Group Co., Ltd. •Kronos Worldwide, Inc. •The Chemours Company •The National Titanium Dioxide Company Limited (Cristal) •Tronox Limited Product Particulars TiO2 for Paint & Coatings TiONA® 595 Is a high performance, multipurpose chloride-process rutile TiO2 pigment with excellent dispersion, opacity, gloss and durability; used in various interior and exterior, water and solvent based coating applications REGIONS COVERED •North America (United States, Canada and Mexico) •Europe (France, Germany, Italy, Spain, United Kingdom and Rest of Europe) •Asia-Pacific (China, India, Japan, South Korea and Rest of Asia-Pacific) •South America(Argentina, Brazil and Rest of South America) •Rest of World TiONA® 121 Is an alumina / silica modified chloride-process rutile TiO2 pigment used as a multipurpose product in a variety of interior and exterior coatings applications …………………….more …………………….more Click here to buy the report Page 2
Titanium Dioxide (TiO2) – A Global Market Overview August 2016 |322 Pages | 242 Charts | Price $4050 TABLE OF CONTENTS 2.4 Multi-Purpose TiO2 for Multiple Purposes ......... 30 2.5 Major Role for Black Titanium Dioxide Nanoparticles in Clean Energy Photocatalysis ......... 31 2.6 Controlling Crystalline Structure of Titanium Dioxide through a Novel Technique ......................... 32 5.1.1.2 Industrial Paints & Coatings ......................... 55 Chart 13: Global Titanium Dioxide Market Analysis (2012- 2022) in Industrial Paints & Coatings Applications by Geographic Region – North America, Europe, Asia-Pacific, South America and Rest of World in 000’ Metric Tons ... 55 Chart 14: Glance at 2012, 2017 and 2022 Global Titanium Dioxide Volume Market Share (%) in Industrial Paints & Coatings Applications by Geographic Region – North America, Europe, Asia-Pacific, South America and Rest of World ............................................................................. 56 5.1.1.3 Paper ........................................................... 57 Chart 15: Global Titanium Dioxide Market Analysis (2012- 2022) in Paper Applications by Geographic Region – North America, Europe, Asia-Pacific, South America and Rest of World in 000’ Metric Tons .............................................. 57 Chart 16: Glance at 2012, 2017 and 2022 Global Titanium Dioxide Volume Market Share (%) in Paper Applications by Geographic Region – North America, Europe, Asia-Pacific, South America and Rest of World ................................... 58 5.1.1.4 Plastics ......................................................... 59 Chart 17: Global Titanium Dioxide Market Analysis (2012- 2022) in Plastics Applications by Geographic Region – North America, Europe, Asia-Pacific, South America and Rest of World in 000’ Metric Tons .................................. 59 Chart 18: Glance at 2012, 2017 and 2022 Global Titanium Dioxide Volume Market Share (%) in Plastics Applications by Geographic Region – North America, Europe, Asia- Pacific, South America and Rest of World ....................... 60 5.1.1.5 Other Applications ....................................... 61 Chart 19: Global Titanium Dioxide Market Analysis (2012- 2022) in Other Applications by Geographic Region – North America, Europe, Asia-Pacific, South America and Rest of World in 000’ Metric Tons .............................................. 61 Chart 20: Glance at 2012, 2017 and 2022 Global Titanium Dioxide Volume Market Share (%) in Other Applications by Geographic Region – North America, Europe, Asia-Pacific, South America and Rest of World ................................... 62 5.2 Global Titanium Dioxide Value Market Overview by Application .......................................................... 63 Chart 21: Global Titanium Dioxide Market Analysis (2012- 2022) by Application – Architectural Paints & Coatings, Industrial Paints & Coatings, Paper, Plastics and Other Applications in USD Million ............................................ 63 Chart 22: Glance at 2012, 2017 and 2022 Global Titanium Dioxide Value Market Share (%) by Application – Architectural Paints & Coatings, Industrial Paints & Coatings, Paper, Plastics and Other Applications ............ 64 5.2.1 Titanium Dioxide Application Value Market Overview by Global Region ...................................... 65 5.2.1.1 Architectural Paints & Coatings ................... 65 Chart 23: Global Titanium Dioxide Market Analysis (2012- 2022) in Architectural Paints & Coatings Applications by Geographic Region – North America, Europe, Asia-Pacific, South America and Rest of World in USD Million ........... 65 Chart 24: Glance at 2012, 2017 and 2022 Global Titanium Dioxide Value Market Share (%) in Architectural Paints & Coatings Applications by Geographic Region – North America, Europe, Asia-Pacific, South America and Rest of World ............................................................................. 66 5.2.1.2 Industrial Paints & Coatings ......................... 67 Chart 25: Global Titanium Dioxide Market Analysis (2012- 2022) in Industrial Paints & Coatings Applications by Geographic Region – North America, Europe, Asia-Pacific, South America and Rest of World in USD Million ........... 67 Chart 26: Glance at 2012, 2017 and 2022 Global Titanium Dioxide Value Market Share (%) in Industrial Paints & Coatings Applications by Geographic Region – North America, Europe, Asia-Pacific, South America and Rest of World ............................................................................. 68 5.2.1.3 Paper ........................................................... 69 Chart 27: Global Titanium Dioxide Market Analysis (2012- 2022) in Paper Applications by Geographic Region – North America, Europe, Asia-Pacific, South America and Rest of World in USD Million ...................................................... 69 PART A: GLOBAL MARKET PERSPECTIVE ........ 1 1. INTRODUCTION .................................................. 1 Chart 1: Global Titanium Dioxide Market (2012, 2016 & 2022).... 2 Chart 2: Global Titanium Dioxide Market (2016 & 2022) by Geographic Region ........................................................... 3 1.1 Product Outline ................................................ 4 1.1.1 Origin, Deposits and Resources of Titanium Minerals .. 4 1.1.1.1 Titanium Resources........................................ 4 Table 1: Properties of Specific Titanium Minerals ............. 5 1.1.1.2 Principal Mineral Deposits of Titanium .......... 5 1.1.2 Titanium Ores ................................................... 5 1.1.2.1 Classification .................................................. 5 1.1.2.2 Purification .................................................... 6 1.1.2.2.1 Upgradation of Ilmenite to Slag and UGS ... 6 1.1.2.2.2 Beneficiation of Ilmenite to Synthetic Rutile .......... 7 1.1.2.2.2.1 Becher Process ......................................... 7 1.1.2.2.2.2 Benilite Process ........................................ 7 1.1.3 Production of Titanium Dioxide Pigments ........ 7 1.1.3.1 Sulfate Process ............................................... 8 1.1.3.2 Chloride Process ............................................ 9 1.1.3.3 Argex Technology (AT) Process .................... 11 1.1.3.3.1 Beneficial Properties of the AT Process .... 12 1.1.3.4 Comparison Between the Three Processes .. 13 Table 2: Comparison Between Sulfate, Chloride and AT Processes.........................................................................13 1.1.4 Properties of Titanium Dioxide ....................... 14 Table 3: Refractive Index, Refractive Tinting Strength and Specific Gravity of Common White Pigments ..................14 1.1.5 Applications of Titanium Dioxide .................... 16 1.1.5.1 Paints and Coatings ...................................... 16 Table 4: Refractive Indices of Pigments and Vehicles Used in Manufacturing Paints and Coatings .............................17 1.1.5.2 Paper............................................................ 18 1.1.5.3 Plastics ......................................................... 19 Table 5: Refractive Indices of Commonly Used White Pigments and Polymers ...................................................20 1.1.5.4 Other Applications ....................................... 20 1.1.5.4.1 Printing Inks .............................................. 20 1.1.5.4.2 Cosmetics and Pharmaceuticals ................ 20 1.1.5.4.3 Textiles ...................................................... 21 1.1.5.4.4 Food Industry ............................................ 21 1.1.5.4.5 Titanium Dioxide Nanomaterials............... 21 1.2 Application Analysis – A Global Snapshot ........ 22 1.2.1 Architectural Paints & Coatings ...................... 22 Chart 3: Trending of Global Titanium Dioxide Consumption in Architectural Paints & Coatings (2016 & 2022) in ‘000 Metric Tons .....................................................................22 1.2.2 Industrial Paints & Coatings ............................ 23 Chart 4: Trending of Global Titanium Dioxide Consumption in Industrial Paints & Coatings (2016 & 2022) in ‘000 Metric Tons .....................................................................23 1.2.3 Paper .............................................................. 24 Chart 5: Trending of Global Titanium Dioxide Consumption in Paper (2016 & 2022) in ‘000 Metric Tons ....................24 1.2.4 Plastics ............................................................ 25 Chart 6: Trending of Global Titanium Dioxide Consumption in Plastics (2016 & 2022) in ‘000 Metric Tons ..................25 1.2.5 Other Applications .......................................... 26 Chart 7: Trending of Global Titanium Dioxide Consumption in Other Applications (2016 & 2022) in ‘000 Metric Tons 26 3. KEY GLOBAL PLAYERS ........................................ 33 Cnnc Hua Yuan Titanium Dioxide Co., Ltd. (China) .......... 33 Evonik Industries Ag (Germany) ...................................... 34 Guangdong Huiyun Titanium Industry Corporation Limited (China) ............................................................................ 35 Henan Billions Chemicals Co., Ltd. (China) ...................... 36 Huntsman International Llc (United States) .................... 38 Jiangsu Taibai Group Co., Ltd. (China) ............................. 39 Kronos Worldwide, Inc. (United States) .......................... 40 The Chemours Company (United States) ........................ 41 The National Titanium Dioxide Company Limited (Cristal) (Saudi Arabia) ................................................................. 42 Tronox Limited (United States) ....................................... 44 4. KEY BUSINESS & PRODUCT TRENDS ................... 45 Launch of Cristal's New Sulfate Rutile TiO2 Product, TiONA® 242 ..................................................................... 45 Rise in the Prices of All CristalACTiV™ Ultrafine TiO2 Products .......................................................................... 45 Kronos to Raise Global Prices of all its Titanium Dioxide Products .......................................................................... 45 Use of Henan Billions' Chloride-based TiO2 in Producing PPG Coatings ................................................................... 45 Closing of Chemours' Edge Moor TiO2 Production Unit .. 46 Chemours, the Spin-off of DuPont's Performance Chemicals Segment ......................................................... 46 China's TiO2 Market to Transforms with the Unification of Henan Billions and Lomon............................................... 46 Argex and PVS to Form Iron By-Products Distribution Pact .... 46 Rise in the Prices of All Ti-Pure™ TiO2 Grades by DuPont 47 VP NKT 65, Evonik's New Developmental TiO2 Grade ..... 47 VV Titanium Pigments to Invest Rs. 100 Crore in a New Coated Rutile Facility ...................................................... 47 DuPont Titanium Technologies to Broaden its High- Efficiency, Low-Cost TiO2 Plant in Mexico ....................... 47 Launch of Ti-Pure One Coat™ by DuPont Titanium Technologies ................................................................... 48 Huntsman Acquires Rockwood's TiO2 Pigments Business48 Establishment of Argex's First Industrial Scale TiO2 Manufacturing Plant and a Complete R&D Centre in Valleyfield ....................................................................... 48 Argex Mining Inc. Renamed as Argex Titanium Inc. ......... 48 Price of Titanium Dioxide Hiked by Evonik Industries AG 49 Argex to Enhance PPG TiO2 Technology ......................... 49 5. GLOBAL MARKET OVERVIEW ............................. 50 Chart 8: Global Titanium Dioxide Market Analysis (2012-2022) in Volume (000’ Metric Tons) and Value (USD Million) .......... 50 5.1 Global Titanium Dioxide Volume Market Overview by Application .......................................................... 51 Chart 9: Global Titanium Dioxide Market Analysis (2012- 2022) by Application – Architectural Paints & Coatings, Industrial Paints & Coatings, Paper, Plastics and Other Applications in 000’ Metric Tons ..................................... 51 Chart 10: Glance at 2012, 2017 and 2022 Global Titanium Dioxide Volume Market Share (%) by Application – Architectural Paints & Coatings, Industrial Paints & Coatings, Paper, Plastics and Other Applications ............ 52 5.1.1 Titanium Dioxide Application Volume Market Overview by Global Region ...................................... 53 5.1.1.1 Architectural Paints & Coatings ................... 53 Chart 11: Global Titanium Dioxide Market Analysis (2012- 2022) in Architectural Paints & Coatings Applications by Geographic Region – North America, Europe, Asia-Pacific, South America and Rest of World in 000’ Metric Tons .... 53 Chart 12: Glance at 2012, 2017 and 2022 Global Titanium Dioxide Volume Market Share (%) in Architectural Paints & Coatings Applications by Geographic Region – North America, Europe, Asia-Pacific, South America and Rest of World ......... 54 2. KEY MARKET TRENDS ........................................ 27 2.1 Titanium Dioxide-Based Flat Lens Offers Promise to Revolutionize Optical Technology ....................... 27 2.2 TiO2 Photocatalyst Used in Advanced Single Step Process for Obtaining Liquid Hydrocarbon Fuel from CO2 and Water ......................................................... 28 2.3 Two-Minute Rechargeable and Two-Decade Life Batteries with Titanium Dioxide Anodes.................. 29 Click here to buy the report Page 3
Titanium Dioxide (TiO2) – A Global Market Overview August 2016 |322 Pages | 242 Charts | Price $4050 Chart 28: Glance at 2012, 2017 and 2022 Global Titanium Dioxide Value Market Share (%) in Paper Applications by Geographic Region – North America, Europe, Asia-Pacific, South America and Rest of World ...................................70 5.2.1.4 Plastics ......................................................... 71 Chart 29: Global Titanium Dioxide Market Analysis (2012- 2022) in Plastics Applications by Geographic Region – North America, Europe, Asia-Pacific, South America and Rest of World in USD Million ...........................................71 Chart 30: Glance at 2012, 2017 and 2022 Global Titanium Dioxide Value Market Share (%) in Plastics Applications by Geographic Region – North America, Europe, Asia-Pacific, South America and Rest of World ...................................72 5.2.1.5 Other Applications ....................................... 73 Chart 31: Global Titanium Dioxide Market Analysis (2012- 2022) in Other Applications by Geographic Region – North America, Europe, Asia-Pacific, South America and Rest of World in USD Million .......................................................73 Chart 32: Glance at 2012, 2017 and 2022 Global Titanium Dioxide Value Market Share (%) in Other Applications by Geographic Region – North America, Europe, Asia-Pacific, South America and Rest of World ...................................74 Chart 60: North American Titanium Dioxide Market Analysis (2012-2022) in Paper Applications by Geographic Region – United States, Canada and Mexico in USD Million ............... 102 Chart 61: Glance at 2012, 2017 and 2022 North American Titanium Dioxide Value Market Share (%) in Paper Applications by Geographic Region – United States, Canada and Mexico ...................................................... 103 1.3.1.4 Plastics ....................................................... 104 Chart 62: North American Titanium Dioxide Market Analysis (2012-2022) in Plastics Applications by Geographic Region – United States, Canada and Mexico in USD Million ................................................................... 104 Chart 63: Glance at 2012, 2017 and 2022 North American Titanium Dioxide Value Market Share (%) in Plastics Applications by Geographic Region – United States, Canada and Mexico ...................................................... 105 1.3.1.5 Other Applications ..................................... 106 Chart 64: North American Titanium Dioxide Market Analysis (2012-2022) in Other Applications by Geographic Region – United States, Canada and Mexico in USD Million............ 106 Chart 65: Glance at 2012, 2017 and 2022 North American Titanium Dioxide Value Market Share (%) in Other Applications by Geographic Region – United States, Canada and Mexico ...................................................... 107 1.4 Major Market Players ...................................... 108 Argex Titanium Inc. (Canada) ........................................ 108 Huntsman International LLC (United States) ................. 109 Kronos Worldwide, Inc. (United States) ........................ 110 The Chemours Company (United States) ...................... 111 The Kish Company, Inc. (United States) ........................ 112 Tronox Limited (United States) ..................................... 113 1.2.1.1 Architectural Paints & Coatings ................... 86 Chart 44: North American Titanium Dioxide Market Analysis (2012-2022) in Architectural Paints & Coatings Applications by Geographic Region – United States, Canada and Mexico in Thousand Metric Tons ................. 86 Chart 45: Glance at 2012, 2017 and 2022 North American Titanium Dioxide Volume Market Share (%) in Architectural Paints & Coatings Applications by Geographic Region – United States, Canada and Mexico 87 1.2.1.2 Industrial Paints & Coatings ......................... 88 Chart 46: North American Titanium Dioxide Market Analysis (2012-2022) in Industrial Paints & Coatings Applications by Geographic Region – United States, Canada and Mexico in Thousand Metric Tons ................. 88 Chart 47: Glance at 2012, 2017 and 2022 North American Titanium Dioxide Volume Market Share (%) in Industrial Paints & Coatings Applications by Geographic Region – United States, Canada and Mexico ................................. 89 1.2.1.3 Paper ........................................................... 90 Chart 48: North American Titanium Dioxide Market Analysis (2012-2022) in Paper Applications by Geographic Region – United States, Canada and Mexico in Thousand Metric Tons ..................................................................... 90 Chart 49: Glance at 2012, 2017 and 2022 North American Titanium Dioxide Volume Market Share (%) in Paper Applications by Geographic Region – United States, Canada and Mexico ......................................................... 91 1.2.1.4 Plastics ......................................................... 92 Chart 50: North American Titanium Dioxide Market Analysis (2012-2022) in Plastics Applications by Geographic Region – United States, Canada and Mexico in Thousand Metric Tons .................................................... 92 Chart 51: Glance at 2012, 2017 and 2022 North American Titanium Dioxide Volume Market Share (%) in Plastics Applications by Geographic Region – United States, Canada and Mexico ......................................................... 93 1.2.1.5 Other Applications ....................................... 94 Chart 52: North American Titanium Dioxide Market Analysis (2012-2022) in Other Applications by Geographic Region – United States, Canada and Mexico in Thousand Metric Tons ..................................................................... 94 Chart 53: Glance at 2012, 2017 and 2022 North American Titanium Dioxide Volume Market Share (%) in Other Applications by Geographic Region – United States, Canada and Mexico ......................................................... 95 1.3 North American Titanium Dioxide Value Market Overview by Application .......................................... 96 Chart 54: North American Titanium Dioxide Market Analysis (2012-2022) by Application – Architectural Paints & Coatings, Industrial Paints & Coatings, Paper, Plastics and Other Applications in USD Million ............................ 96 Chart 55: Glance at 2012, 2017 and 2022 North American Titanium Dioxide Value Market Share (%) by Application – Architectural Paints & Coatings, Industrial Paints & Coatings, Paper, Plastics and Other Applications ............ 97 1.3.1 Titanium Dioxide Application Value Market Overview by North American Region ....................... 98 1.3.1.1 Architectural Paints & Coatings ................... 98 Chart 56: North American Titanium Dioxide Market Analysis (2012-2022) in Architectural Paints & Coatings Applications by Geographic Region – United States, Canada and Mexico in USD Million ................................. 98 Chart 57: Glance at 2012, 2017 and 2022 North American Titanium Dioxide Value Market Share (%) in Architectural Paints & Coatings Applications by Geographic Region – United States, Canada and Mexico ................................. 99 1.3.1.2 Industrial Paints & Coatings ....................... 100 Chart 58: North American Titanium Dioxide Market Analysis (2012-2022) in Industrial Paints & Coatings Applications by Geographic Region – United States, Canada and Mexico in USD Million ............................... 100 Chart 59: Glance at 2012, 2017 and 2022 North American Titanium Dioxide Value Market Share (%) in Industrial Paints & Coatings Applications by Geographic Region – United States, Canada and Mexico ............................... 101 1.3.1.3 Paper ......................................................... 102 PART B: REGIONAL MARKET PERSPECTIVE ... 75 Global Titanium Dioxide Market Overview by Geographic Region ............................................... 75 Volume Analysis ....................................................... 75 Chart 33: Global Titanium Dioxide Market Analysis (2012- 2022) by Geographic Region – North America, Europe, Asia-Pacific, South America and Rest of World in 000’ Metric Tons .....................................................................75 Chart 34: Glance at 2012, 2017 and 2022 Global Titanium Dioxide Volume Market Share (%) by Geographic Region – North America, Europe, Asia-Pacific, South America and Rest of World ..................................................................76 Value Analysis .......................................................... 77 Chart 35: Global Titanium Dioxide Market Analysis (2012-2022) by Geographic Region – North America, Europe, Asia-Pacific, South America and Rest of World in USD Million ................... 77 Chart 36: Glance at 2012, 2017 and 2022 Global Titanium Dioxide Value Market Share (%) by Geographic Region – North America, Europe, Asia-Pacific, South America and Rest of World ..................................................................78 1.5 North American Titanium Dioxide Market Overview by Country ............................................. 114 1.5.1 The United States ....................................... 114 Chart 66: United States Titanium Dioxide Market Analysis (2012-2022) in Volume (000’ Metric Tons) and Value (USD Million) ......................................................................... 114 1.5.1.1 Market Overview by Application ............... 115 Volume Analysis .................................................... 115 Chart 67: United States Titanium Dioxide Market Analysis (2012-2022) by Application – Architectural Paints & Coatings, Industrial Paints & Coatings, Paper, Plastics and Other Applications in 000’ Metric Tons ........................ 115 Chart 68: Glance at 2012, 2017 and 2022 United States Titanium Dioxide Volume Market Share (%) by Application – Architectural Paints & Coatings, Industrial Paints & Coatings, Paper, Plastics and Other Applications .......... 116 Value Analysis ........................................................ 117 Chart 69: United States Titanium Dioxide Market Analysis (2012-2022) by Application – Architectural Paints & Coatings, Industrial Paints & Coatings, Paper, Plastics and Other Applications in USD Million ................................ 117 Chart 70: Glance at 2012, 2017 and 2022 United States Titanium Dioxide Value Market Share (%) by Application – Architectural Paints & Coatings, Industrial Paints & Coatings, Paper, Plastics and Other Applications .......... 118 REGIONAL MARKET OVERVIEW ............................. 79 1. NORTH AMERICA .............................................. 79 Chart 37: North American Titanium Dioxide Market Analysis (2012-2022) in Volume (000’ Metric Tons) and Value (USD Million) .........................................................79 1.1 North American Titanium Dioxide Market Overview by Geographic Region .............................. 80 Volume Analysis ....................................................... 80 Chart 38: North American Titanium Dioxide Market Analysis (2012-2022) by Geographic Region – United States, Canada and Mexico in 000’ Metric Tons ..............80 Chart 39: Glance at 2012, 2017 and 2022 North American Titanium Dioxide Volume Market Share (%) by Geographic Region – United States, Canada and Mexico ...................81 Value Analysis .......................................................... 82 Chart 40: North American Titanium Dioxide Market Analysis (2012-2022) by Geographic Region – United States, Canada and Mexico in USD Million ......................82 Chart 41: Glance at 2012, 2017 and 2022 North American Titanium Dioxide Value Market Share (%) by Geographic Region – United States, Canada and Mexico ...................83 1.2 North American Titanium Dioxide Volume Market Overview by Application .......................................... 84 Chart 42: North American Titanium Dioxide Market Analysis (2012-2022) by Application – Architectural Paints & Coatings, Industrial Paints & Coatings, Paper, Plastics and Other Applications in 000’ Metric Tons ....................84 Chart 43: Glance at 2012, 2017 and 2022 North American Titanium Dioxide Volume Market Share (%) by Application – Architectural Paints & Coatings, Industrial Paints & Coatings, Paper, Plastics and Other Applications .............85 1.2.1 Titanium Dioxide Application Volume Market Overview by North American Region ....................... 86 1.5.2 Canada ....................................................... 119 Chart 71: Canadian Titanium Dioxide Market Analysis (2012-2022) in Volume (000’ Metric Tons) and Value (USD Million) ......................................................................... 119 1.5.2.1 Market Overview by Application ............... 120 Volume Analysis .................................................... 120 Chart 72: Canadian Titanium Dioxide Market Analysis (2012-2022) by Application – Architectural Paints & Coatings, Industrial Paints & Coatings, Paper, Plastics and Other Applications in 000’ Metric Tons ........................ 120 Chart 73: Glance at 2012, 2017 and 2022 Canadian Titanium Dioxide Volume Market Share (%) by Application – Architectural Paints & Coatings, Industrial Paints & Coatings, Paper, Plastics and Other Applications .......... 121 Value Analysis ........................................................ 122 Chart 74: Canadian Titanium Dioxide Market Analysis (2012-2022) by Application – Architectural Paints & Coatings, Industrial Paints & Coatings, Paper, Plastics and Other Applications in USD Million ................................ 122 Click here to buy the report Page 4
Titanium Dioxide (TiO2) – A Global Market Overview August 2016 |322 Pages | 242 Charts | Price $4050 Chart 75: Glance at 2012, 2017 and 2022 Canadian Titanium Dioxide Value Market Share (%) by Application – Architectural Paints & Coatings, Industrial Paints & Coatings, Paper, Plastics and Other Applications ........... 123 Chart 90: European Titanium Dioxide Market Analysis (2012-2022) in Industrial Paints & Coatings Applications by Geographic Region – France, Germany, Italy, Spain, United Kingdom and Rest of Europe in Thousand Metric Tons . 138 Chart 91: Glance at 2012, 2017 and 2022 European Titanium Dioxide Volume Market Share (%) in Industrial Paints & Coatings Applications by Geographic Region – France, Germany, Italy, Spain, United Kingdom and Rest of Europe .......................................................................... 139 2.2.1.3 Paper ......................................................... 140 Chart 92: European Titanium Dioxide Market Analysis (2012-2022) in Paper Applications by Geographic Region – France, Germany, Italy, Spain, United Kingdom and Rest of Europe in Thousand Metric Tons .................................. 140 Chart 93: Glance at 2012, 2017 and 2022 European Titanium Dioxide Volume Market Share (%) in Paper Applications by Geographic Region – France, Germany, Italy, Spain, United Kingdom and Rest of Europe .......... 141 2.2.1.4 Plastics ....................................................... 142 Chart 94: European Titanium Dioxide Market Analysis (2012- 2022) in Plastics Applications by Geographic Region – France, Germany, Italy, Spain, United Kingdom and Rest of Europe in Thousand Metric Tons ...................................... 142 Chart 95: Glance at 2012, 2017 and 2022 European Titanium Dioxide Volume Market Share (%) in Plastics Applications by Geographic Region – France, Germany, Italy, Spain, United Kingdom and Rest of Europe .......... 143 2.2.1.5 Other Applications ..................................... 144 Chart 96: European Titanium Dioxide Market Analysis (2012-2022) in Other Applications by Geographic Region – France, Germany, Italy, Spain, United Kingdom and Rest of Europe in Thousand Metric Tons .................................. 144 Chart 97: Glance at 2012, 2017 and 2022 European Titanium Dioxide Volume Market Share (%) in Other Applications by Geographic Region – France, Germany, Italy, Spain, United Kingdom and Rest of Europe .......... 145 2.3 European Titanium Dioxide Value Market Overview by Application ........................................ 146 Chart 98: European Titanium Dioxide Market Analysis (2012-2022) by Application – Architectural Paints & Coatings, Industrial Paints & Coatings, Paper, Plastics and Other Applications in USD Million ................................. 146 Chart 99: Glance at 2012, 2017 and 2022 European Titanium Dioxide Value Market Share (%) by Application – Architectural Paints & Coatings, Industrial Paints & Coatings, Paper, Plastics and Other Applications .......... 147 2.3.1 Titanium Dioxide Application Value Market Overview by European Region ............................... 148 2.3.1.1 Architectural Paints & Coatings ................. 148 Chart 100: European Titanium Dioxide Market Analysis (2012-2022) in Architectural Paints & Coatings Applications by Geographic Region – France, Germany, Italy, Spain, United Kingdom and Rest of Europe in USD Million ........................................................................... 148 Chart 101: Glance at 2012, 2017 and 2022 European Titanium Dioxide Value Market Share (%) in Architectural Paints & Coatings Applications by Geographic Region – France, Germany, Italy, Spain, United Kingdom and Rest of Europe .......................................................................... 149 2.3.1.2 Industrial Paints & Coatings ....................... 150 Chart 102: European Titanium Dioxide Market Analysis (2012-2022) in Industrial Paints & Coatings Applications by Geographic Region – France, Germany, Italy, Spain, United Kingdom and Rest of Europe in USD Million ................. 150 Chart 103: Glance at 2012, 2017 and 2022 European Titanium Dioxide Value Market Share (%) in Industrial Paints & Coatings Applications by Geographic Region – France, Germany, Italy, Spain, United Kingdom and Rest of Europe .......................... 151 2.3.1.3 Paper ......................................................... 152 Chart 104: European Titanium Dioxide Market Analysis (2012-2022) in Paper Applications by Geographic Region – France, Germany, Italy, Spain, United Kingdom and Rest of Europe in USD Million ................................................... 152 Chart 105: Glance at 2012, 2017 and 2022 European Titanium Dioxide Value Market Share (%) in Paper Applications by Geographic Region – France, Germany, Italy, Spain, United Kingdom and Rest of Europe .......... 153 2.3.1.4 Plastics ....................................................... 154 Chart 106: European Titanium Dioxide Market Analysis (2012-2022) in Plastics Applications by Geographic Region – France, Germany, Italy, Spain, United Kingdom and Rest of Europe in USD Million ........................................................ 154 Chart 107: Glance at 2012, 2017 and 2022 European Titanium Dioxide Value Market Share (%) in Plastics Applications by Geographic Region – France, Germany, Italy, Spain, United Kingdom and Rest of Europe .......... 155 2.3.1.5 Other Applications ..................................... 156 Chart 108: European Titanium Dioxide Market Analysis (2012-2022) in Other Applications by Geographic Region – France, Germany, Italy, Spain, United Kingdom and Rest of Europe in USD Million ................................................... 156 Chart 109: Glance at 2012, 2017 and 2022 European Titanium Dioxide Value Market Share (%) in Other Applications by Geographic Region – France, Germany, Italy, Spain, United Kingdom and Rest of Europe .......... 157 2.4 Major Market Players ...................................... 158 Cinkarna, Metalurško Kemična Industrija Celje, D.D. (Cinkarna Celje D.D.) (Slovenia) .................................... 158 Evonik Industries AG (Germany) ................................... 159 Grupa Azoty Zaklady Chemiczne "Police" SA (Grupa Azoty Police) (Poland) ............................................................ 160 2.5 European Titanium Dioxide Market Overview by Country .................................................................. 161 2.5.1 France ........................................................ 161 Chart 110: French Titanium Dioxide Market Analysis (2012-2022) in Volume (000’ Metric Tons) and Value (USD Million) ......................................................................... 161 2.5.1.1 Market Overview by Application ............... 162 Volume Analysis .................................................... 162 Chart 111: French Titanium Dioxide Market Analysis (2012-2022) by Application – Architectural Paints & Coatings, Industrial Paints & Coatings, Paper, Plastics and Other Applications in 000’ Metric Tons ........................ 162 Chart 112: Glance at 2012, 2017 and 2022 French Titanium Dioxide Volume Market Share (%) by Application – Architectural Paints & Coatings, Industrial Paints & Coatings, Paper, Plastics and Other Applications .......... 163 Value Analysis ........................................................ 164 Chart 113: French Titanium Dioxide Market Analysis (2012-2022) by Application – Architectural Paints & Coatings, Industrial Paints & Coatings, Paper, Plastics and Other Applications in USD Million ................................ 164 Chart 114: Glance at 2012, 2017 and 2022 French Titanium Dioxide Value Market Share (%) by Application – Architectural Paints & Coatings, Industrial Paints & Coatings, Paper, Plastics and Other Applications .......... 165 2.5.2 Germany .................................................... 166 Chart 115: German Titanium Dioxide Market Analysis (2012-2022) in Volume (000’ Metric Tons) and Value (USD Million) ......................................................................... 166 2.5.2.1 Market Overview by Application ............... 167 Volume Analysis .................................................... 167 Chart 116: German Titanium Dioxide Market Analysis (2012-2022) by Application – Architectural Paints & Coatings, Industrial Paints & Coatings, Paper, Plastics and Other Applications in 000’ Metric Tons ........................ 167 Chart 117: Glance at 2012, 2017 and 2022 German Titanium Dioxide Volume Market Share (%) by Application – Architectural Paints & Coatings, Industrial Paints & Coatings, Paper, Plastics and Other Applications .............................. 168 Value Analysis ........................................................ 169 Chart 118: German Titanium Dioxide Market Analysis (2012-2022) by Application – Architectural Paints & Coatings, Industrial Paints & Coatings, Paper, Plastics and Other Applications in USD Million ................................ 169 Chart 119: Glance at 2012, 2017 and 2022 German Titanium Dioxide Value Market Share (%) by Application – Architectural Paints & Coatings, Industrial Paints & Coatings, Paper, Plastics and Other Applications .......... 170 2.5.3 Italy ........................................................... 171 Chart 120: Italian Titanium Dioxide Market Analysis (2012- 2022) in Volume (000’ Metric Tons) and Value (USD Million) ......................................................................... 171 1.5.3 Mexico ....................................................... 124 Chart 76: Mexican Titanium Dioxide Market Analysis (2012-2022) in Volume (000’ Metric Tons) and Value (USD Million) .......................................................................... 124 1.5.3.1 Market Overview by Application ............... 125 Volume Analysis ..................................................... 125 Chart 77: Mexican Titanium Dioxide Market Analysis (2012-2022) by Application – Architectural Paints & Coatings, Industrial Paints & Coatings, Paper, Plastics and Other Applications in 000’ Metric Tons ......................... 125 Chart 78: Glance at 2012, 2017 and 2022 Mexican Titanium Dioxide Volume Market Share (%) by Application – Architectural Paints & Coatings, Industrial Paints & Coatings, Paper, Plastics and Other Applications .............................. 126 Value Analysis ........................................................ 127 Chart 79: Mexican Titanium Dioxide Market Analysis (2012-2022) by Application – Architectural Paints & Coatings, Industrial Paints & Coatings, Paper, Plastics and Other Applications in USD Million ................................. 127 Chart 80: Glance at 2012, 2017 and 2022 Mexican Titanium Dioxide Value Market Share (%) by Application – Architectural Paints & Coatings, Industrial Paints & Coatings, Paper, Plastics and Other Applications ........... 128 2. EUROPE .......................................................... 129 Chart 81: European Titanium Dioxide Market Analysis (2012-2022) in Volume (000’ Metric Tons) and Value (USD Million) .......................................................................... 129 2.1 European Titanium Dioxide Market Overview by Geographic Region................................................. 130 Volume Analysis ..................................................... 130 Chart 82: European Titanium Dioxide Market Analysis (2012-2022) by Geographic Region – France, Germany, Italy, Spain, United Kingdom and Rest of Europe in 000’ Metric Tons ................................................................... 130 Chart 83: Glance at 2012, 2017 and 2022 European Titanium Dioxide Volume Market Share (%) by Geographic Region – France, Germany, Italy, Spain, United Kingdom and Rest of Europe ........................................................ 131 Value Analysis ........................................................ 132 Chart 84: European Titanium Dioxide Market Analysis (2012-2022) by Geographic Region – France, Germany, Italy, Spain, United Kingdom and Rest of Europe in USD Million ........................................................................... 132 Chart 85: Glance at 2012, 2017 and 2022 European Titanium Dioxide Value Market Share (%) by Geographic Region – France, Germany, Italy, Spain, United Kingdom and Rest of Europe ........................................................ 133 2.2 European Titanium Dioxide Volume Market Overview by Application ........................................ 134 Chart 86: European Titanium Dioxide Market Analysis (2012-2022) by Application – Architectural Paints & Coatings, Industrial Paints & Coatings, Paper, Plastics and Other Applications in 000’ Metric Tons ......................... 134 Chart 87: Glance at 2012, 2017 and 2022 European Titanium Dioxide Volume Market Share (%) by Application – Architectural Paints & Coatings, Industrial Paints & Coatings, Paper, Plastics and Other Applications .............................. 135 2.2.1 Titanium Dioxide Application Volume Market Overview by European Region ............................... 136 2.2.1.1 Architectural Paints & Coatings ................. 136 Chart 88: European Titanium Dioxide Market Analysis (2012-2022) in Architectural Paints & Coatings Applications by Geographic Region – France, Germany, Italy, Spain, United Kingdom and Rest of Europe in Thousand Metric Tons ................................................... 136 Chart 89: Glance at 2012, 2017 and 2022 European Titanium Dioxide Volume Market Share (%) in Architectural Paints & Coatings Applications by Geographic Region – France, Germany, Italy, Spain, United Kingdom and Rest of Europe ......................................... 137 2.2.1.2 Industrial Paints & Coatings ....................... 138 Click here to buy the report Page 5
Titanium Dioxide (TiO2) – A Global Market Overview August 2016 |322 Pages | 242 Charts | Price $4050 Chart 137: Glance at 2012, 2017 and 2022 Rest of Europe Titanium Dioxide Volume Market Share (%) by Application – Architectural Paints & Coatings, Industrial Paints & Coatings, Paper, Plastics and Other Applications .............................. 188 Value Analysis ........................................................ 189 Chart 138: Rest of Europe Titanium Dioxide Market Analysis (2012-2022) by Application – Architectural Paints & Coatings, Industrial Paints & Coatings, Paper, Plastics and Other Applications in USD Million .......................... 189 Chart 139: Glance at 2012, 2017 and 2022 Rest of Europe Titanium Dioxide Value Market Share (%) by Application – Architectural Paints & Coatings, Industrial Paints & Coatings, Paper, Plastics and Other Applications .......... 190 2.5.3.1 Market Overview by Application ............... 172 Volume Analysis ..................................................... 172 Chart 121: Italian Titanium Dioxide Market Analysis (2012- 2022) by Application – Architectural Paints & Coatings, Industrial Paints & Coatings, Paper, Plastics and Other Applications in 000’ Metric Tons ................................... 172 Chart 122: Glance at 2012, 2017 and 2022 Italian Titanium Dioxide Volume Market Share (%) by Application – Architectural Paints & Coatings, Industrial Paints & Coatings, Paper, Plastics and Other Applications ........... 173 Value Analysis ........................................................ 174 Chart 123: Italian Titanium Dioxide Market Analysis (2012- 2022) by Application – Architectural Paints & Coatings, Industrial Paints & Coatings, Paper, Plastics and Other Applications in USD Million ........................................... 174 Chart 124: Glance at 2012, 2017 and 2022 Italian Titanium Dioxide Value Market Share (%) by Application – Architectural Paints & Coatings, Industrial Paints & Coatings, Paper, Plastics and Other Applications ........... 175 3.2.1.4 Plastics ....................................................... 204 Chart 153: Asia-Pacific Titanium Dioxide Market Analysis (2012-2022) in Plastics Applications by Geographic Region – China, India, Japan, South Korea and Rest of Asia-Pacific in Thousand Metric Tons ....................................................... 204 Chart 154: Glance at 2012, 2017 and 2022 Asia-Pacific Titanium Dioxide Volume Market Share (%) in Plastics Applications by Geographic Region – China, India, Japan, South Korea and Rest of Asia-Pacific ............................ 205 3.2.1.5 Other Applications ..................................... 206 Chart 155: Asia-Pacific Titanium Dioxide Market Analysis (2012-2022) in Other Applications by Geographic Region – China, India, Japan, South Korea and Rest of Asia-Pacific in Thousand Metric Tons .................................................. 206 Chart 156: Glance at 2012, 2017 and 2022 Asia-Pacific Titanium Dioxide Volume Market Share (%) in Other Applications by Geographic Region – China, India, Japan, South Korea and Rest of Asia-Pacific ............................ 207 3.3 Asia-Pacific Titanium Dioxide Value Market Overview by Application ........................................ 208 Chart 157: Asia-Pacific Titanium Dioxide Market Analysis (2012-2022) by Application – Architectural Paints & Coatings, Industrial Paints & Coatings, Paper, Plastics and Other Applications in USD Million ................................ 208 Chart 158: Glance at 2012, 2017 and 2022 Asia-Pacific Titanium Dioxide Value Market Share (%) by Application – Architectural Paints & Coatings, Industrial Paints & Coatings, Paper, Plastics and Other Applications .......... 209 3.3.1 Titanium Dioxide Application Value Market Overview by Asia-Pacific Region ............................ 210 3.3.1.1 Architectural Paints & Coatings ................. 210 Chart 159: Asia-Pacific Titanium Dioxide Market Analysis (2012-2022) in Architectural Paints & Coatings Applications by Geographic Region – China, India, Japan, South Korea and Rest of Asia-Pacific in USD Million ..... 210 Chart 160: Glance at 2012, 2017 and 2022 Asia-Pacific Titanium Dioxide Value Market Share (%) in Architectural Paints & Coatings Applications by Geographic Region – China, India, Japan, South Korea and Rest of Asia-Pacific ................ 211 3.3.1.2 Industrial Paints & Coatings ....................... 212 Chart 161: Asia-Pacific Titanium Dioxide Market Analysis (2012-2022) in Industrial Paints & Coatings Applications by Geographic Region – China, India, Japan, South Korea and Rest of Asia-Pacific in USD Million ................................ 212 Chart 162: Glance at 2012, 2017 and 2022 Asia-Pacific Titanium Dioxide Value Market Share (%) in Industrial Paints & Coatings Applications by Geographic Region – China, India, Japan, South Korea and Rest of Asia-Pacific ...................... 213 3.3.1.3 Paper ......................................................... 214 Chart 163: Asia-Pacific Titanium Dioxide Market Analysis (2012-2022) in Paper Applications by Geographic Region – China, India, Japan, South Korea and Rest of Asia-Pacific in USD Million ................................................................... 214 Chart 164: Glance at 2012, 2017 and 2022 Asia-Pacific Titanium Dioxide Value Market Share (%) in Paper Applications by Geographic Region – China, India, Japan, South Korea and Rest of Asia-Pacific ............................ 215 3.3.1.4 Plastics ....................................................... 216 Chart 165: Asia-Pacific Titanium Dioxide Market Analysis (2012-2022) in Plastics Applications by Geographic Region – China, India, Japan, South Korea and Rest of Asia-Pacific in USD Million ........................................................................ 216 Chart 166: Glance at 2012, 2017 and 2022 Asia-Pacific Titanium Dioxide Value Market Share (%) in Plastics Applications by Geographic Region – China, India, Japan, South Korea and Rest of Asia-Pacific ............................ 217 3.3.1.5 Other Applications ..................................... 218 Chart 167: Asia-Pacific Titanium Dioxide Market Analysis (2012-2022) in Other Applications by Geographic Region – China, India, Japan, South Korea and Rest of Asia-Pacific in USD Million ................................................................... 218 Chart 168: Glance at 2012, 2017 and 2022 Asia-Pacific Titanium Dioxide Value Market Share (%) in Other Applications by Geographic Region – China, India, Japan, South Korea and Rest of Asia-Pacific ............................ 219 3.4 Major Market Players ...................................... 220 Anhui Annada Titanium Industry Co., Ltd. (China) ........ 220 3. ASIA-PACIFIC ................................................... 191 Chart 140: Asia-Pacific Titanium Dioxide Market Analysis (2012-2022) in Volume (000’ Metric Tons) and Value (USD Million) ......................................................................... 191 3.1 Asia-Pacific Titanium Dioxide Market Overview by Geographic Region ................................................ 192 Volume Analysis..................................................... 192 Chart 141: Asia-Pacific Titanium Dioxide Market Analysis (2012-2022) by Geographic Region – China, India, Japan, South Korea and Rest of Asia-Pacific in 000’ Metric Tons . 192 Chart 142: Glance at 2012, 2017 and 2022 Asia-Pacific Titanium Dioxide Volume Market Share (%) by Geographic Region – China, India, Japan, South Korea and Rest of Asia- Pacific ........................................................................... 193 Value Analysis ........................................................ 194 Chart 143: Asia-Pacific Titanium Dioxide Market Analysis (2012-2022) by Geographic Region – China, India, Japan, South Korea and Rest of Asia-Pacific in USD Million ...... 194 Chart 144: Glance at 2012, 2017 and 2022 Asia-Pacific Titanium Dioxide Value Market Share (%) by Geographic Region – China, India, Japan, South Korea and Rest of Asia- Pacific ........................................................................... 195 3.2 Asia-Pacific Titanium Dioxide Volume Market Overview by Application ........................................ 196 Chart 145: Asia-Pacific Titanium Dioxide Market Analysis (2012-2022) by Application – Architectural Paints & Coatings, Industrial Paints & Coatings, Paper, Plastics and Other Applications in 000’ Metric Tons ......................... 196 Chart 146: Glance at 2012, 2017 and 2022 Asia-Pacific Titanium Dioxide Volume Market Share (%) by Application – Architectural Paints & Coatings, Industrial Paints & Coatings, Paper, Plastics and Other Applications .............................. 197 3.2.1 Titanium Dioxide Application Volume Market Overview by Asia-Pacific Region ............................ 198 3.2.1.1 Architectural Paints & Coatings ................. 198 Chart 147: Asia-Pacific Titanium Dioxide Market Analysis (2012-2022) in Architectural Paints & Coatings Applications by Geographic Region – China, India, Japan, South Korea and Rest of Asia-Pacific in Thousand Metric Tons .............................................................................. 198 Chart 148: Glance at 2012, 2017 and 2022 Asia-Pacific Titanium Dioxide Volume Market Share (%) in Architectural Paints & Coatings Applications by Geographic Region – China, India, Japan, South Korea and Rest of Asia-Pacific ........................................................ 199 3.2.1.2 Industrial Paints & Coatings ....................... 200 Chart 149: Asia-Pacific Titanium Dioxide Market Analysis (2012-2022) in Industrial Paints & Coatings Applications by Geographic Region – China, India, Japan, South Korea and Rest of Asia-Pacific in Thousand Metric Tons ................ 200 Chart 150: Glance at 2012, 2017 and 2022 Asia-Pacific Titanium Dioxide Volume Market Share (%) in Industrial Paints & Coatings Applications by Geographic Region – China, India, Japan, South Korea and Rest of Asia-Pacific .......................... 201 3.2.1.3 Paper ......................................................... 202 Chart 151: Asia-Pacific Titanium Dioxide Market Analysis (2012-2022) in Paper Applications by Geographic Region – China, India, Japan, South Korea and Rest of Asia-Pacific in Thousand Metric Tons .................................................. 202 Chart 152: Glance at 2012, 2017 and 2022 Asia-Pacific Titanium Dioxide Volume Market Share (%) in Paper Applications by Geographic Region – China, India, Japan, South Korea and Rest of Asia-Pacific ............................. 203 2.5.4 Spain ......................................................... 176 Chart 125: Spanish Titanium Dioxide Market Analysis (2012-2022) in Volume (000’ Metric Tons) and Value (USD Million) .......................................................................... 176 2.5.4.1 Market Overview by Application ............... 177 Volume Analysis ..................................................... 177 Chart 126: Spanish Titanium Dioxide Market Analysis (2012-2022) by Application – Architectural Paints & Coatings, Industrial Paints & Coatings, Paper, Plastics and Other Applications in 000’ Metric Tons ......................... 177 Chart 127: Glance at 2012, 2017 and 2022 Spanish Titanium Dioxide Volume Market Share (%) by Application – Architectural Paints & Coatings, Industrial Paints & Coatings, Paper, Plastics and Other Applications .............................. 178 Value Analysis ........................................................ 179 Chart 128: Spanish Titanium Dioxide Market Analysis (2012-2022) by Application – Architectural Paints & Coatings, Industrial Paints & Coatings, Paper, Plastics and Other Applications in USD Million ................................. 179 Chart 129: Glance at 2012, 2017 and 2022 Spanish Titanium Dioxide Value Market Share (%) by Application – Architectural Paints & Coatings, Industrial Paints & Coatings, Paper, Plastics and Other Applications ........... 180 2.5.5 The United Kingdom .................................. 181 Chart 130: United Kingdom Titanium Dioxide Market Analysis (2012-2022) in Volume (000’ Metric Tons) and Value (USD Million) ....................................................... 181 2.5.5.1 Market Overview by Application ............... 182 Volume Analysis ..................................................... 182 Chart 131: United Kingdom Titanium Dioxide Market Analysis (2012-2022) by Application – Architectural Paints & Coatings, Industrial Paints & Coatings, Paper, Plastics and Other Applications in 000’ Metric Tons .................. 182 Chart 132: Glance at 2012, 2017 and 2022 United Kingdom Titanium Dioxide Volume Market Share (%) by Application – Architectural Paints & Coatings, Industrial Paints & Coatings, Paper, Plastics and Other Applications .............................. 183 Value Analysis ........................................................ 184 Chart 133: United Kingdom Titanium Dioxide Market Analysis (2012-2022) by Application – Architectural Paints & Coatings, Industrial Paints & Coatings, Paper, Plastics and Other Applications in USD Million .......................... 184 Chart 134: Glance at 2012, 2017 and 2022 United Kingdom Titanium Dioxide Value Market Share (%) by Application – Architectural Paints & Coatings, Industrial Paints & Coatings, Paper, Plastics and Other Applications ........... 185 2.5.6 Rest of Europe ........................................... 186 Chart 135: Rest of Europe Titanium Dioxide Market Analysis (2012-2022) in Volume (000’ Metric Tons) and Value (USD Million) ....................................................... 186 2.5.6.1 Market Overview by Application ............... 187 Volume Analysis ..................................................... 187 Chart 136: Rest of Europe Titanium Dioxide Market Analysis (2012-2022) by Application – Architectural Paints & Coatings, Industrial Paints & Coatings, Paper, Plastics and Other Applications in 000’ Metric Tons .................. 187 Click here to buy the report Page 6
Titanium Dioxide (TiO2) – A Global Market Overview August 2016 |322 Pages | 242 Charts | Price $4050 Bluestar New Chemical Materials Co., Ltd. (China) ........ 220 CNNC Hua Yuan Titanium Dioxide Co., Ltd. (China) ....... 221 Cosmo Chemical Co., Ltd. (South Korea)........................ 222 Guangdong Huiyun Titanium Industry Corporation Limited (China) ........................................................................... 223 Guangxi Jinmao Titanium Co., Ltd. (China) .................... 224 Henan Billions Chemicals Co., Ltd. (China) ..................... 225 Sichuan Lomon Titanium Industry Co., Ltd. (China) ....... 226 Jiangsu Taibai Group Co., Ltd. (China) ........................... 227 Jiangxi Tikon Titanium Co., Ltd. (China) ......................... 228 Kilburn Chemicals Limited (India) .................................. 229 Nanjing Titanium Dioxide Chemical Co., Ltd. (China) ..... 230 Ningbo Xinfu Titanium Dioxide Co., Ltd. (China) ............ 231 Pangang Group Vanadium Titanium & Resources Co., Ltd. (China) ........................................................................... 232 Panzhihua Dongfang Titanium Industry Co., Ltd. (China) . 233 Shandong Doguide Group Co., Ltd. (China) ................... 234 Shandong Jinhai Titanium Resources Technology Co., Ltd. (China) ........................................................................... 235 Tayca Corporation (Japan) ............................................. 236 V.V. Titanium Pigments (P) Ltd (India) ........................... 237 Yunnan Dahutong Industry & Trading Co., Ltd. (China) . 238 3.5 Asia-Pacific Titanium Dioxide Market Overview by Country .................................................................. 239 3.5.1 China ......................................................... 239 Chart 169: Chinese Titanium Dioxide Market Analysis (2012-2022) in Volume (000’ Metric Tons) and Value (USD Million) .......................................................................... 239 3.5.1.1 Market Overview by Application ............... 240 Volume Analysis ..................................................... 240 Chart 170: Chinese Titanium Dioxide Market Analysis (2012-2022) by Application – Architectural Paints & Coatings, Industrial Paints & Coatings, Paper, Plastics and Other Applications in 000’ Metric Tons ......................... 240 Chart 171: Glance at 2012, 2017 and 2022 Chinese Titanium Dioxide Value Market Share (%) by Application – Architectural Paints & Coatings, Industrial Paints & Coatings, Paper, Plastics and Other Applications ........... 241 Value Analysis ........................................................ 242 Chart 172: Chinese Titanium Dioxide Market Analysis (2012-2022) by Application – Architectural Paints & Coatings, Industrial Paints & Coatings, Paper, Plastics and Other Applications in USD Million ................................. 242 Chart 173: Glance at 2012, 2017 and 2022 Chinese Titanium Dioxide Volume Market Share (%) by Application – Architectural Paints & Coatings, Industrial Paints & Coatings, Paper, Plastics and Other Applications ........... 243 Volume Analysis..................................................... 250 Chart 180: Japanese Titanium Dioxide Market Analysis (2012-2022) by Application – Architectural Paints & Coatings, Industrial Paints & Coatings, Paper, Plastics and Other Applications in 000’ Metric Tons ......................... 250 Chart 181: Glance at 2012, 2017 and 2022 Japanese Titanium Dioxide Volume Market Share (%) by Application – Architectural Paints & Coatings, Industrial Paints & Coatings, Paper, Plastics and Other Applications .......... 251 Value Analysis ........................................................ 252 Chart 182: Japanese Titanium Dioxide Market Analysis (2012-2022) by Application – Architectural Paints & Coatings, Industrial Paints & Coatings, Paper, Plastics and Other Applications in USD Million ................................. 252 Chart 183: Glance at 2012, 2017 and 2022 Japanese Titanium Dioxide Value Market Share (%) by Application – Architectural Paints & Coatings, Industrial Paints & Coatings, Paper, Plastics and Other Applications .......... 253 3.5.4 South Korea ............................................... 254 Chart 184: South Korean Titanium Dioxide Market Analysis (2012- 2022) in Volume (000’ Metric Tons) and Value (USD Million) ....... 254 3.5.4.1 Market Overview by Application ............... 255 Volume Analysis..................................................... 255 Chart 185: South Korean Titanium Dioxide Market Analysis (2012-2022) by Application – Architectural Paints & Coatings, Industrial Paints & Coatings, Paper, Plastics and Other Applications in 000’ Metric Tons ......................... 255 Chart 186: Glance at 2012, 2017 and 2022 South Korean Titanium Dioxide Volume Market Share (%) by Application – Architectural Paints & Coatings, Industrial Paints & Coatings, Paper, Plastics and Other Applications .......... 256 Value Analysis ........................................................ 257 Chart 187: South Korean Titanium Dioxide Market Analysis (2012-2022) by Application – Architectural Paints & Coatings, Industrial Paints & Coatings, Paper, Plastics and Other Applications in USD Million ................................. 257 Chart 188: Glance at 2012, 2017 and 2022 South Korean Titanium Dioxide Value Market Share (%) by Application – Architectural Paints & Coatings, Industrial Paints & Coatings, Paper, Plastics and Other Applications .......... 258 3.5.5 Rest of Asia-Pacific ..................................... 259 Chart 189: Rest of Asia-Pacific Titanium Dioxide Market Analysis (2012-2022) in Volume (000’ Metric Tons) and Value (USD Million) ....................................................... 259 3.5.5.1 Market Overview by Application ............... 260 Volume Analysis..................................................... 260 Chart 190: Rest of Asia-Pacific Titanium Dioxide Market Analysis (2012-2022) by Application – Architectural Paints & Coatings, Industrial Paints & Coatings, Paper, Plastics and Other Applications in 000’ Metric Tons .................. 260 Chart 191: Glance at 2012, 2017 and 2022 Rest of Asia-Pacific Titanium Dioxide Volume Market Share (%) by Application – Architectural Paints & Coatings, Industrial Paints & Coatings, Paper, Plastics and Other Applications .................................. 261 Value Analysis ........................................................ 262 Chart 192: Rest of Asia-Pacific Titanium Dioxide Market Analysis (2012-2022) by Application – Architectural Paints & Coatings, Industrial Paints & Coatings, Paper, Plastics and Other Applications in USD Million .......................... 262 Chart 193: Glance at 2012, 2017 and 2022 Rest of Asia-Pacific Titanium Dioxide Value Market Share (%) by Application – Architectural Paints & Coatings, Industrial Paints & Coatings, Paper, Plastics and Other Applications .................................. 263 Value Analysis ........................................................ 267 Chart 197: South American Titanium Dioxide Market Analysis (2012-2022) by Geographic Region – Argentina, Brazil and Rest of South America in USD Million ........... 267 Chart 198: Glance at 2012, 2017 and 2022 South American Titanium Dioxide Value Market Share (%) by Geographic Region – Argentina, Brazil and Rest of South America .. 268 4.2 South American Titanium Dioxide Volume Market Overview by Application ........................................ 269 Chart 199: South American Titanium Dioxide Market Analysis (2012-2022) by Application – Architectural Paints & Coatings, Industrial Paints & Coatings, Paper, Plastics and Other Applications in 000’ Metric Tons ................. 269 Chart 200: Glance at 2012, 2017 and 2022 South American Titanium Dioxide Volume Market Share (%) by Application – Architectural Paints & Coatings, Industrial Paints & Coatings, Paper, Plastics and Other Applications .............................. 270 4.2.1 Titanium Dioxide Application Volume Market Overview by South American Region ..................... 271 4.2.1.1 Architectural Paints & Coatings ................. 271 Chart 201: South American Titanium Dioxide Market Analysis (2012-2022) in Architectural Paints & Coatings Applications by Geographic Region – Argentina, Brazil and Rest of South America in Thousand Metric Tons .......... 271 Chart 202: Glance at 2012, 2017 and 2022 South American Titanium Dioxide Volume Market Share (%) in Architectural Paints & Coatings Applications by Geographic Region – Argentina, Brazil and Rest of South America ........................................................................ 272 4.2.1.2 Industrial Paints & Coatings ....................... 273 Chart 203: South American Titanium Dioxide Market Analysis (2012-2022) in Industrial Paints & Coatings Applications by Geographic Region – Argentina, Brazil and Rest of South America in Thousand Metric Tons .......... 273 Chart 204: Glance at 2012, 2017 and 2022 South American Titanium Dioxide Volume Market Share (%) in Industrial Paints & Coatings Applications by Geographic Region – Argentina, Brazil and Rest of South America ................ 274 4.2.1.3 Paper ......................................................... 275 Chart 205: South American Titanium Dioxide Market Analysis (2012-2022) in Paper Applications by Geographic Region – Argentina, Brazil and Rest of South America in Thousand Metric Tons .................................................. 275 Chart 206: Glance at 2012, 2017 and 2022 South American Titanium Dioxide Volume Market Share (%) in Paper Applications by Geographic Region – Argentina, Brazil and Rest of South America .................................................. 276 4.2.1.4 Plastics ....................................................... 277 Chart 207: South American Titanium Dioxide Market Analysis (2012-2022) in Plastics Applications by Geographic Region – Argentina, Brazil and Rest of South America in Thousand Metric Tons ................................ 277 Chart 208: Glance at 2012, 2017 and 2022 South American Titanium Dioxide Volume Market Share (%) in Plastics Applications by Geographic Region – Argentina, Brazil and Rest of South America .................................................. 278 4.2.1.5 Other Applications ..................................... 279 Chart 209: South American Titanium Dioxide Market Analysis (2012-2022) in Other Applications by Geographic Region – Argentina, Brazil and Rest of South America in Thousand Metric Tons .................................................. 279 Chart 210: Glance at 2012, 2017 and 2022 South American Titanium Dioxide Volume Market Share (%) in Other Applications by Geographic Region – Argentina, Brazil and Rest of South America .................................................. 280 4.3 South American Titanium Dioxide Value Market Overview by Application ........................................ 281 Chart 211: South American Titanium Dioxide Market Analysis (2012-2022) by Application – Architectural Paints & Coatings, Industrial Paints & Coatings, Paper, Plastics and Other Applications in USD Million .......................... 281 Chart 212: Glance at 2012, 2017 and 2022 South American Titanium Dioxide Value Market Share (%) by Application – Architectural Paints & Coatings, Industrial Paints & Coatings, Paper, Plastics and Other Applications .......... 282 4.3.1 Titanium Dioxide Application Value Market Overview by South American Region ..................... 283 3.5.2 India .......................................................... 244 Chart 174: Indian Titanium Dioxide Market Analysis (2012- 2022) in Volume (000’ Metric Tons) and Value (USD Million) .......................................................................... 244 3.5.2.1 Market Overview by Application ............... 245 Volume Analysis ..................................................... 245 Chart 175: Indian Titanium Dioxide Market Analysis (2012- 2022) by Application – Architectural Paints & Coatings, Industrial Paints & Coatings, Paper, Plastics and Other Applications in 000’ Metric Tons ................................... 245 Chart 176: Glance at 2012, 2017 and 2022 Indian Titanium Dioxide Volume Market Share (%) by Application – Architectural Paints & Coatings, Industrial Paints & Coatings, Paper, Plastics and Other Applications ........... 246 Value Analysis ........................................................ 247 Chart 177: Indian Titanium Dioxide Market Analysis (2012- 2022) by Application – Architectural Paints & Coatings, Industrial Paints & Coatings, Paper, Plastics and Other Applications in USD Million ........................................... 247 Chart 178: Glance at 2012, 2017 and 2022 Indian Titanium Dioxide Value Market Share (%) by Application – Architectural Paints & Coatings, Industrial Paints & Coatings, Paper, Plastics and Other Applications ........... 248 4. SOUTH AMERICA ............................................. 264 Chart 194: South American Titanium Dioxide Market Analysis (2012-2022) in Volume (000’ Metric Tons) and Value (USD Million) ....................................................... 264 4.1 South American Titanium Dioxide Market Overview by Geographic Region ............................ 265 Volume Analysis..................................................... 265 Chart 195: South American Titanium Dioxide Market Analysis (2012-2022) by Geographic Region – Argentina, Brazil and Rest of South America in 000’ Metric Tons ... 265 Chart 196: Glance at 2012, 2017 and 2022 South American Titanium Dioxide Volume Market Share (%) by Geographic Region – Argentina, Brazil and Rest of South America .. 266 3.5.3 Japan ......................................................... 249 Chart 179: Japanese Titanium Dioxide Market Analysis (2012-2022) in Volume (000’ Metric Tons) and Value (USD Million) .......................................................................... 249 3.5.3.1 Market Overview by Application ............... 250 Click here to buy the report Page 7
Titanium Dioxide (TiO2) – A Global Market Overview August 2016 |322 Pages | 242 Charts | Price $4050 4.4.1.1 Market Overview by Application ............... 294 Volume Analysis..................................................... 294 Chart 224: Argentine Titanium Dioxide Market Analysis (2012-2022) by Application – Architectural Paints & Coatings, Industrial Paints & Coatings, Paper, Plastics and Other Applications in 000’ Metric Tons ......................... 294 Chart 225: Glance at 2012, 2017 and 2022 Argentine Titanium Dioxide Volume Market Share (%) by Application – Architectural Paints & Coatings, Industrial Paints & Coatings, Paper, Plastics and Other Applications .......... 295 Value Analysis ........................................................ 296 Chart 226: Argentine Titanium Dioxide Market Analysis (2012-2022) by Application – Architectural Paints & Coatings, Industrial Paints & Coatings, Paper, Plastics and Other Applications in USD Million ................................. 296 Chart 227: Glance at 2012, 2017 and 2022 Argentine Titanium Dioxide Value Market Share (%) by Application – Architectural Paints & Coatings, Industrial Paints & Coatings, Paper, Plastics and Other Applications .......... 297 4.4.2 Brazil .......................................................... 298 Chart 228: Brazilian Titanium Dioxide Market Analysis (2012-2022) in Volume (000’ Metric Tons) and Value (USD Million) ................. 298 4.4.2.1 Market Overview by Application ............... 299 Volume Analysis..................................................... 299 Chart 229: Brazilian Titanium Dioxide Market Analysis (2012-2022) by Application – Architectural Paints & Coatings, Industrial Paints & Coatings, Paper, Plastics and Other Applications in 000’ Metric Tons ......................... 299 Chart 230: Glance at 2012, 2017 and 2022 Brazilian Titanium Dioxide Volume Market Share (%) by Application – Architectural Paints & Coatings, Industrial Paints & Coatings, Paper, Plastics and Other Applications .............................. 300 Value Analysis ........................................................ 301 Chart 231: Brazilian Titanium Dioxide Market Analysis (2012-2022) by Application – Architectural Paints & Coatings, Industrial Paints & Coatings, Paper, Plastics and Other Applications in USD Million ................................. 301 Chart 232: Glance at 2012, 2017 and 2022 Brazilian Titanium Dioxide Value Market Share (%) by Application – Architectural Paints & Coatings, Industrial Paints & Coatings, Paper, Plastics and Other Applications .......... 302 4.4.3 Rest of South America ................................ 303 Chart 233: Rest of South America Titanium Dioxide Market Analysis (2012-2022) in Volume (000’ Metric Tons) and Value (USD Million) ....................................................... 303 4.4.3.1 Market Overview by Application ............... 304 Volume Analysis..................................................... 304 Chart 234: Rest of South America Titanium Dioxide Market Analysis (2012-2022) by Application – Architectural Paints & Coatings, Industrial Paints & Coatings, Paper, Plastics and Other Applications in 000’ Metric Tons .................. 304 4.3.1.1 Architectural Paints & Coatings ................. 283 Chart 213: South American Titanium Dioxide Market Analysis (2012-2022) in Architectural Paints & Coatings Applications by Geographic Region – Argentina, Brazil and Rest of South America in USD Million ............................ 283 Chart 214: Glance at 2012, 2017 and 2022 South American Titanium Dioxide Value Market Share (%) in Architectural Paints & Coatings Applications by Geographic Region – Argentina, Brazil and Rest of South America ................. 284 4.3.1.2 Industrial Paints & Coatings ....................... 285 Chart 215: South American Titanium Dioxide Market Analysis (2012-2022) in Industrial Paints & Coatings Applications by Geographic Region – Argentina, Brazil and Rest of South America in USD Million ............................ 285 Chart 216: Glance at 2012, 2017 and 2022 South American Titanium Dioxide Value Market Share (%) in Industrial Paints & Coatings Applications by Geographic Region – Argentina, Brazil and Rest of South America ................. 286 4.3.1.3 Paper.......................................................... 287 Chart 217: South American Titanium Dioxide Market Analysis (2012-2022) in Paper Applications by Geographic Region – Argentina, Brazil and Rest of South America in USD Million ................................................................... 287 Chart 218: Glance at 2012, 2017 and 2022 South American Titanium Dioxide Value Market Share (%) in Paper Applications by Geographic Region – Argentina, Brazil and Rest of South America ................................................... 288 4.3.1.4 Plastics ....................................................... 289 Chart 219: South American Titanium Dioxide Market Analysis (2012-2022) in Plastics Applications by Geographic Region – Argentina, Brazil and Rest of South America in USD Million .................................................. 289 Chart 220: Glance at 2012, 2017 and 2022 South American Titanium Dioxide Value Market Share (%) in Plastics Applications by Geographic Region – Argentina, Brazil and Rest of South America ................................................... 290 4.3.1.5 Other Applications ..................................... 291 Chart 221: South American Titanium Dioxide Market Analysis (2012-2022) in Other Applications by Geographic Region – Argentina, Brazil and Rest of South America in USD Million . 291 Chart 222: Glance at 2012, 2017 and 2022 South American Titanium Dioxide Value Market Share (%) in Other Applications by Geographic Region – Argentina, Brazil and Rest of South America ................................................... 292 4.4 South American Titanium Dioxide Market Overview by Country ............................................. 293 4.4.1 Argentina ................................................... 293 Chart 223: Argentine Titanium Dioxide Market Analysis (2012-2022) in Volume (000’ Metric Tons) and Value (USD Million) .......................................................................... 293 Chart 235: Glance at 2012, 2017 and 2022 Rest of South America Titanium Dioxide Volume Market Share (%) by Application – Architectural Paints & Coatings, Industrial Paints & Coatings, Paper, Plastics and Other Applications .............. 305 Value Analysis ........................................................ 306 Chart 236: Rest of South America Titanium Dioxide Market Analysis (2012-2022) by Application – Architectural Paints & Coatings, Industrial Paints & Coatings, Paper, Plastics and Other Applications in USD Million .......................... 306 Chart 237: Glance at 2012, 2017 and 2022 Rest of South America Titanium Dioxide Value Market Share (%) by Application – Architectural Paints & Coatings, Industrial Paints & Coatings, Paper, Plastics and Other Applications .............. 307 5. REST OF WORLD .............................................. 308 Chart 238: Rest of World Titanium Dioxide Market Analysis (2012-2022) in Volume (000’ Metric Tons) and Value (USD Million) ......................................................................... 308 5.1 Market Overview by Application ..................... 309 Volume Analysis .................................................... 309 Chart 239: Rest of World Titanium Dioxide Market Analysis (2012-2022) by Application – Architectural Paints & Coatings, Industrial Paints & Coatings, Paper, Plastics and Other Applications in 000’ Metric Tons ........................ 309 Chart 240: Glance at 2012, 2017 and 2022 Rest of World Titanium Dioxide Volume Market Share (%) by Application – Architectural Paints & Coatings, Industrial Paints & Coatings, Paper, Plastics and Other Applications .......... 310 Value Analysis ........................................................ 311 Chart 241: Rest of World Titanium Dioxide Market Analysis (2012-2022) by Application – Architectural Paints & Coatings, Industrial Paints & Coatings, Paper, Plastics and Other Applications in USD Million ................................ 311 Chart 242: Glance at 2012, 2017 and 2022 Rest of World Titanium Dioxide Value Market Share (%) by Application – Architectural Paints & Coatings, Industrial Paints & Coatings, Paper, Plastics and Other Applications .......... 312 5.2 The National Titanium Dioxide Company Limited (CRISTAL) (Saudi Arabia) – A Major Player ............. 313 PART C: GUIDE TO THE INDUSTRY ............... 316 1. NORTH AMERICA ........................................................ 316 2. EUROPE ....................................................................... 316 3. ASIA-PACIFIC ............................................................... 317 4. SOUTH AMERICA ......................................................... 320 5. REST OF WORLD .......................................................... 320 PART D: ANNEXURE .................................... 321 1. RESEARCH METHODOLOGY ......................................... 321 2. FEEDBACK ................................................................... 323 About Industry Experts Industry Experts values the most updated and accurate market research and industry analysis to provide unique market research reports for a broad range of industry verticals including Automotive, Transportation, Healthcare, Pharmaceuticals, Food & Beverages, Chemicals, Plastics, Materials, Consumer Goods, Retail, Biotechnology, Construction, Manufacturing and Other industries. Our research reports help our clients to identify and resolve topical issues by providing a complete picture of the market in their respective industry sectors. The Company’s rich collection of market research reports enable the companies to explore market drivers; forecast the future market; and to formulate the right strategies at the right time. INDUSTRY EXPERTS 1-7-19/C, Street No. 8, Habsiguda Hyderabad – 500007, India Phone: +91-40-4018-1314 Fax: +91-40-4027-2381 info@industry-experts.com industry-experts.com Industry Experts’ leading edge publications makes the life easy for corporate strategists, investors, analysts and researchers, start ups, consultants, financial and banking executives, academicians and many more. The company also provides customized research reports to cater the needs of the industry. More about Industry Experts Click here to buy the report Page 8