Download
1 / 6
60 likes | 168 Views
Global consumption of bisphenol-A (BPA) is being spurred by a stable growth in demand from emerging markets, with China, India, Mexico and Russia expected to witness above average growth prospects. Coupled with this trend is a growing demand for the compound in its two major application areas, viz., epoxy resins and polycarbonates. Prospects for future demand for BPA are likely to be bolstered by the growing utilization of this chemical in rotor blade composites that find application in windmills. Wind energy has been garnering widespread global attention as an eco-friendly option in the energy mix and requires the use of strong and resilient wind turbine rotor blades that are reinforced using epoxy resins.

E N D
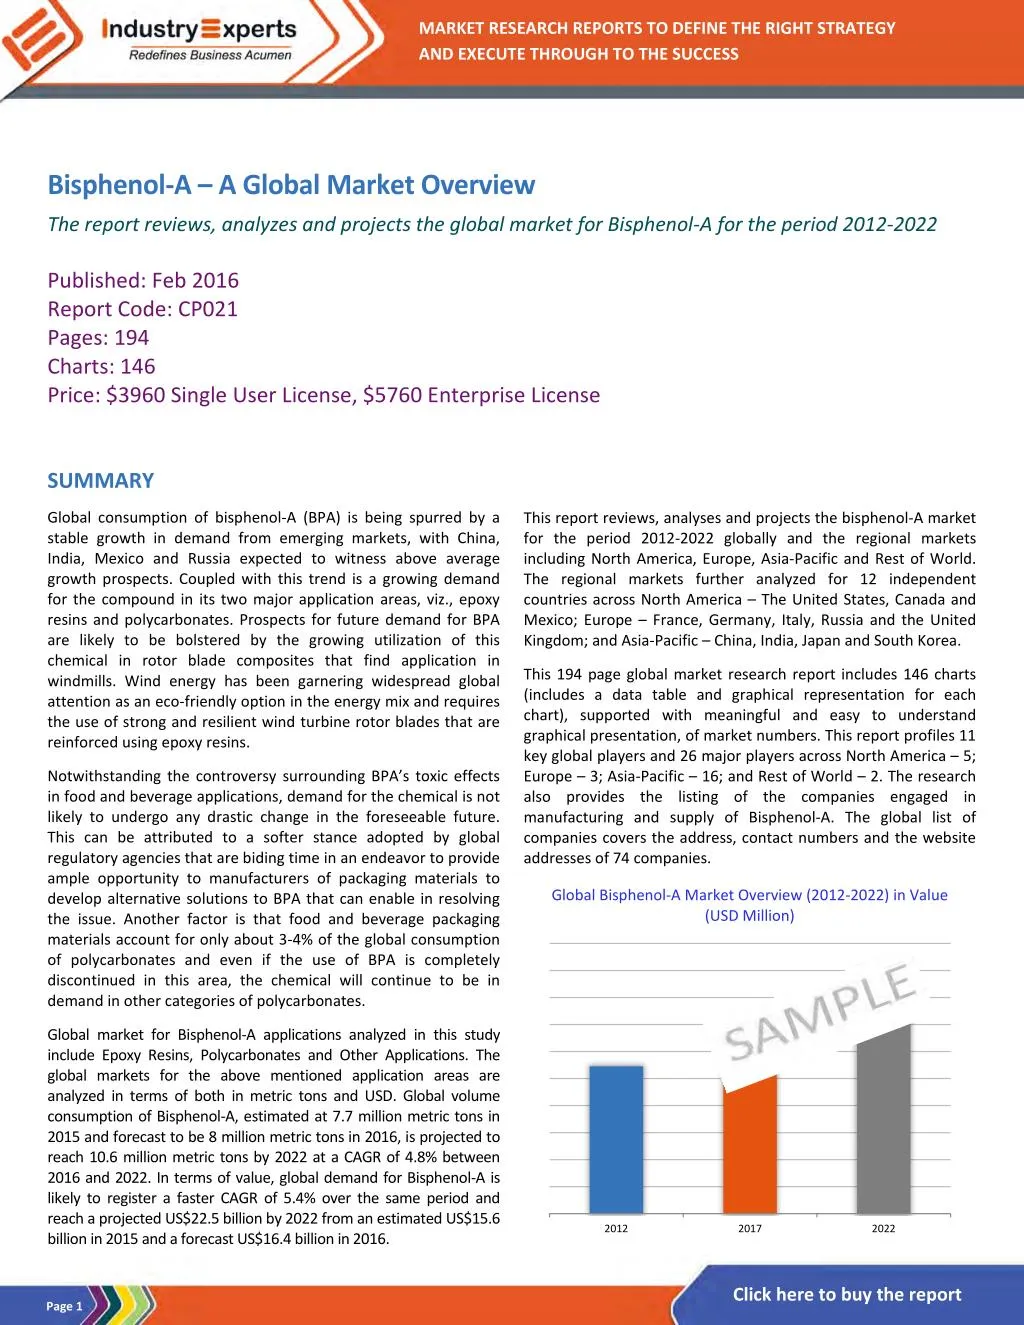
MARKET RESEARCH REPORTS TO DEFINE THE RIGHT STRATEGY AND EXECUTE THROUGH TO THE SUCCESS Bisphenol-A – A Global Market Overview The report reviews, analyzes and projects the global market for Bisphenol-A for the period 2012-2022 Published: Feb 2016 Report Code: CP021 Pages: 194 Charts: 146 Price: $3960 Single User License, $5760 Enterprise License SUMMARY Global consumption of bisphenol-A (BPA) is being spurred by a stable growth in demand from emerging markets, with China, India, Mexico and Russia expected to witness above average growth prospects. Coupled with this trend is a growing demand for the compound in its two major application areas, viz., epoxy resins and polycarbonates. Prospects for future demand for BPA are likely to be bolstered by the growing utilization of this chemical in rotor blade composites that find application in windmills. Wind energy has been garnering widespread global attention as an eco-friendly option in the energy mix and requires the use of strong and resilient wind turbine rotor blades that are reinforced using epoxy resins. This report reviews, analyses and projects the bisphenol-A market for the period 2012-2022 globally and the regional markets including North America, Europe, Asia-Pacific and Rest of World. The regional markets further analyzed for 12 independent countries across North America – The United States, Canada and Mexico; Europe – France, Germany, Italy, Russia and the United Kingdom; and Asia-Pacific – China, India, Japan and South Korea. This 194 page global market research report includes 146 charts (includes a data table and graphical representation for each chart), supported with meaningful and easy to understand graphical presentation, of market numbers. This report profiles 11 key global players and 26 major players across North America – 5; Europe – 3; Asia-Pacific – 16; and Rest of World – 2. The research also provides the listing of the companies engaged in manufacturing and supply of Bisphenol-A. The global list of companies covers the address, contact numbers and the website addresses of 74 companies. Notwithstanding the controversy surrounding BPA’s toxic effects in food and beverage applications, demand for the chemical is not likely to undergo any drastic change in the foreseeable future. This can be attributed to a softer stance adopted by global regulatory agencies that are biding time in an endeavor to provide ample opportunity to manufacturers of packaging materials to develop alternative solutions to BPA that can enable in resolving the issue. Another factor is that food and beverage packaging materials account for only about 3-4% of the global consumption of polycarbonates and even if the use of BPA is completely discontinued in this area, the chemical will continue to be in demand in other categories of polycarbonates. Global Bisphenol-A Market Overview (2012-2022) in Value (USD Million) Global market for Bisphenol-A applications analyzed in this study include Epoxy Resins, Polycarbonates and Other Applications. The global markets for the above mentioned application areas are analyzed in terms of both in metric tons and USD. Global volume consumption of Bisphenol-A, estimated at 7.7 million metric tons in 2015 and forecast to be 8 million metric tons in 2016, is projected to reach 10.6 million metric tons by 2022 at a CAGR of 4.8% between 2016 and 2022. In terms of value, global demand for Bisphenol-A is likely to register a faster CAGR of 5.4% over the same period and reach a projected US$22.5 billion by 2022 from an estimated US$15.6 billion in 2015 and a forecast US$16.4 billion in 2016. 2012 2017 2022 Click here to buy the report Page 1
Bisphenol-A – A Global Market Overview Feb 2016 |194 Pages | 146 Charts | Price $3960 SAMPLE COMPANY PROFILE HEXION INC. (UNITED STATES) 180 East Broad Street Columbus, OH 43215 United States Phone: 614-225-4000 Website: www.hexion.com SAMPLE TABLE/CHART Glance at 2017 Global Bisphenol-A Volume Market Share (%) by Application – Epoxy Resins, Polycarbonates and Other Applications Business Overview Columbus, Ohio-based Hexion Inc was established in 1857 and is an operating subsidiary of Hexion LLC. Formerly called Momentive Specialty Chemicals Inc, the company adopted its present name in January 2015. Hexion is engaged in providing thermosets, specialty products and technical support encompassing a variety of applications and industries globally. Epoxy, Phenolic and Coating Resins and Forest Products Resins constitute the two operating segments of the company. Global Bisphenol-A Market Analysis (2012-2022) by Geographic Region – North America, Europe, Asia-Pacific and Rest of World in '000 Metric Tons Business Divisions Operating Division Particulars Epoxy, Phenolic and Coating Resins Provides epoxy specialty resins, modifiers, and curing agents for use in the automotive, construction, wind energy, aerospace and electronics industries, basic epoxy resins, such as solid epoxy resins and liquid epoxy resins for industrial coatings applications, bisphenol-A and epichlorohydrin products, versatic acids and derivatives under the Versatic, VEOVA vinyl ester, and CARDURA glycidyl ester names used in decorative, automotive and protective coatings, as well as in adhesives and intermediates, phenolic specialty resins and molding compounds under the BORDEN, BAKELITE, DURITE, and CELLOBOND brands for use in after-market automotive and OEM truck brake pads, filtration, aircraft components, and foundry resins, as well as in the production of mineral wool and glass wool, phenolic encapsulated sand and ceramic substrates for use in oil field services and foundry applications, powder polyester resins for industrial coatings, water-based acrylic homopolymers, styrene-acrylic copolymers, acrylic acids, and acrylic monomers, and water-based vinylic resins for building and construction market 2012 2017 2022 KEY PLAYERS PROFILED •Chang Chun Plastics Co Ltd •Covestro AG •Hexion Inc. •Kumho P&B Chemicals Inc •LG Chem Ltd •Mitsubishi Chemical Corporation •Mitsui Chemicals Inc •Nan Ya Plastics Corporation •Nippon Steel & Sumikin Chemical Co Ltd •Olin Corporation •SABIC Innovative Plastics US LLC Forest Product Resins Provides formaldehyde-based resins for the forest products industry and formaldehyde, a raw material used to manufacture other chemicals and products …………………….more …………………….more Click here to buy the report Page 2
Bisphenol-A – A Global Market Overview Feb 2016 |194 Pages | 146 Charts | Price $3960 TABLE OF CONTENTS Value Analysis .......................................................... 30 Chart 4: Global Bisphenol-A Market Analysis (2012-2022) by Application – Epoxy Resins, Polycarbonates and Other Applications in USD Million ............................................. 30 Chart 5: Glance at 2012, 2017 and 2022 Global Bisphenol- A Value Market Share (%) by Application – Epoxy Resins, Polycarbonates and Other Applications .......................... 31 4.1.1 Bisphenol-A Application Market Overview by Geographic Region .................................................. 32 4.1.1.1 Epoxy Resins ................................................ 32 Volume Analysis....................................................... 32 Chart 6: Global Bisphenol-A Market Analysis (2012-2022) in Epoxy Resins by Geographic Region – North America, Europe, Asia-Pacific and Rest of World in '000 Metric Tons ................. 32 Chart 7: Glance at 2012, 2017 and 2022 Global Bisphenol- A Volume Market Share (%) in Epoxy Resins by Geographic Region – North America, Europe, Asia-Pacific and Rest of World .............................................................................. 33 Value Analysis .......................................................... 34 Chart 8: Global Bisphenol-A Market Analysis (2012-2022) in Epoxy Resins by Geographic Region – North America, Europe, Asia-Pacific and Rest of World in USD Million .... 34 Chart 9: Glance at 2012, 2017 and 2022 Global Bisphenol- A Value Market Share (%) in Epoxy Resins by Geographic Region – North America, Europe, Asia-Pacific and Rest of World .............................................................................. 35 4.1.1.2 Polycarbonates ............................................ 36 Volume Analysis....................................................... 36 Chart 10: Global Bisphenol-A Market Analysis (2012-2022) in Polycarbonates by Geographic Region – North America, Europe, Asia-Pacific and Rest of World in '000 Metric Tons ... 36 Chart 11: Glance at 2012, 2017 and 2022 Global Bisphenol-A Volume Market Share (%) in Polycarbonates by Geographic Region – North America, Europe, Asia- Pacific and Rest of World ................................................ 37 Value Analysis .......................................................... 38 Chart 12: Global Bisphenol-A Market Analysis (2012-2022) in Polycarbonates by Geographic Region – North America, Europe, Asia-Pacific and Rest of World in USD Million .... 38 Chart 13: Glance at 2012, 2017 and 2022 Global Bisphenol-A Value Market Share (%) in Polycarbonates by Geographic Region – North America, Europe, Asia-Pacific and Rest of World ........................................................... 39 4.1.1.3 Other Applications ....................................... 40 Volume Analysis....................................................... 40 Chart 14: Global Bisphenol-A Market Analysis (2012-2022) in Other Applications by Geographic Region – North America, Europe, Asia-Pacific and Rest of World in '000 Metric Tons ..................................................................... 40 Chart 15: Glance at 2012, 2017 and 2022 Global Bisphenol-A Market Share (%) in Other Applications by Geographic Region – North America, Europe, Asia-Pacific and Rest of World ........................................................... 41 Value Analysis .......................................................... 42 Chart 16: Global Bisphenol-A Market Analysis (2012-2022) in Other Applications by Geographic Region – North America, Europe, Asia-Pacific and Rest of World in USD Million ........... 42 Chart 17: Glance at 2012, 2017 and 2022 Global Bisphenol-A Value Market Share (%) in Other Applications by Geographic Region – North America, Europe, Asia- Pacific and Rest of World ................................................ 43 Value Analysis .......................................................... 47 Chart 21: Global Bisphenol-A Market Analysis (2012-2022) by Geographic Region – North America, Europe, Asia- Pacific and Rest of World in USD Million ........................ 47 Chart 22: Glance at 2012, 2017 and 2022 Global Bisphenol-A Value Market Share (%) by Geographic Region – North America, Europe, Asia-Pacific and Rest of World 48 PART A: GLOBAL MARKET PERSPECTIVE ........ 1 1. INTRODUCTION .................................................. 1 1.1 Product Outline .................................................... 4 1.1.1 What is Bisphenol-A? ........................................ 4 1.1.2 Grades of Bisphenol-A ...................................... 5 1.1.3 Specifications of Bisphenol-A ............................ 5 1.1.3.1 Standard Product Specifications for Bisphenol-A ... 5 1.1.4 Properties of Bisphenol-A ................................. 6 1.1.4.1 Physical Properties of Bisphenol-A for Commercial Applications ........................................... 6 1.1.4.2 Chemical Properties of Bisphenol-A ............... 6 1.1.5 Production Processes of Bisphenol-A................ 7 1.1.5.1 Acid Catalyzed Condensation of Phenol and Acetone ..................................................................... 7 1.1.5.2 Ion Exchange Resin Catalyzed Condensation of Phenol with Acetone ................................................. 8 1.1.5.3 A Comparison between the Two Processes ... 9 1.1.6 Bisphenol-A Applications ................................ 10 1.1.6.1 Polycarbonates ............................................ 10 1.1.6.2 Epoxy Resins ................................................ 11 1.1.6.2.1 Applications of BPA-Based Polycarbonates and Epoxy Resin Coatings ........................................ 12 1.1.6.3 Other Applications ....................................... 13 1.1.6.3.1 Polysulfones .............................................. 13 1.1.6.3.2 Tetrabromobisphenol A (TBBPA) .............. 13 1.1.6.3.3 Thermal Paper .......................................... 14 REGIONAL MARKET OVERVIEW .................... 49 1. NORTH AMERICA .............................................. 49 Chart 23: North American Bisphenol-A Market Overview (2012- 2022) in Volume ('000 Metric Tons) and Value (USD Million)..... 49 1.1 North American Market Overview by Region .... 50 Volume Analysis ...................................................... 50 Chart 24: North American Bisphenol-A Market Analysis (2012-2022) by Region – United States, Canada and Mexico in '000 Metric Tons ............................................ 50 Chart 25: Glance at 2012, 2017 and 2022 North American Bisphenol-A Volume Market Share (%) by Region – United States, Canada and Mexico ............................................. 51 Value Analysis .......................................................... 52 Chart 26: North American Bisphenol-A Market Analysis (2012-2022) by Region – United States, Canada and Mexico in USD Million .................................................... 52 Chart 27: Glance at 2012, 2017 and 2022 North American Bisphenol-A Value Market Share (%) by Region – United States, Canada and Mexico ............................................. 53 1.2 North American Market Overview by Application ... 54 Volume Analysis ...................................................... 54 Chart 28: North American Bisphenol-A Market Analysis (2012-2022) by Application – Epoxy Resins, Polycarbonates and Other Applications in '000 Metric Tons ........................ 54 Chart 29: Glance at 2012, 2017 and 2022 North American Bisphenol-A Volume Market Share (%) by Application – Epoxy Resins, Polycarbonates and Other Applications ... 55 Value Analysis .......................................................... 56 Chart 30: North American Bisphenol-A Market Analysis (2012-2022) by Application – Epoxy Resins, Polycarbonates and Other Applications in USD Million .. 56 Chart 31: Glance at 2012, 2017 and 2022 North American Bisphenol-A Value Market Share (%) by Application – Epoxy Resins, Polycarbonates and Other Applications ... 57 1.2.1 North American Bisphenol-A Application Market Overview by Region ................................................. 58 1.2.1.1 Epoxy Resins ................................................ 58 Volume Analysis ...................................................... 58 Chart 32: North American Bisphenol-A Market Analysis (2012-2022) in Epoxy Resins by Region – United States, Canada and Mexico in '000 Metric Tons ......................... 58 Chart 33: Glance at 2012, 2017 and 2022 North American Bisphenol-A Volume Market Share (%) in Epoxy Resins by Region – United States, Canada and Mexico .................. 59 Value Analysis .......................................................... 60 Chart 34: North American Bisphenol-A Market Analysis (2012-2022) in Epoxy Resins by Region – United States, Canada and Mexico in USD Million ................................. 60 Chart 35: Glance at 2012, 2017 and 2022 North American Bisphenol-A Value Market Share (%) in Epoxy Resins by Region – United States, Canada and Mexico .................. 61 1.2.1.2 Polycarbonates ............................................ 62 Volume Analysis ...................................................... 62 Chart 36: North American Bisphenol-A Market Analysis (2012-2022) in Polycarbonates by Region – United States, Canada and Mexico in '000 Metric Tons ......................... 62 Chart 37: Glance at 2012, 2017 and 2022 North American Bisphenol-A Volume Market Share (%) in Polycarbonates by Region – United States, Canada and Mexico .............. 63 Value Analysis .......................................................... 64 Chart 38: North American Bisphenol-A Market Analysis (2012-2022) in Polycarbonates by Region – United States, Canada and Mexico in USD Million ................................. 64 Chart 39: Glance at 2012, 2017 and 2022 North American Bisphenol-A Value Market Share (%) in Polycarbonates by Region – United States, Canada and Mexico .................. 65 2. KEY GLOBAL PLAYERS ........................................ 15 Chang Chun Plastics Co Ltd (Taiwan) ...............................15 Covestro AG (Germany) ...................................................16 Hexion Inc. (United States) ..............................................17 Kumho P&B Chemicals Inc (South Korea) ........................18 LG Chem Ltd (South Korea) .............................................18 Mitsubishi Chemical Corporation (Japan) ........................19 Mitsui Chemicals Inc (Japan) ...........................................19 Nan Ya Plastics Corporation (Taiwan) ..............................20 Nippon Steel & Sumikin Chemical Co Ltd (Japan) ............21 Olin Corporation (United States) .....................................22 Sabic Innovative Plastics US LLC (United States) ..............23 3. KEY BUSINESS AND PRODUCT TRENDS .............. 24 ALTIVIA Petrochemicals LLC Acquires Haverhill Chemicals’ Phenol-Acetone-AMS-BPA Operations ............................24 Olin Corp Takes Over Dow’s Chlorine and Epoxy Businesses .......................................................................24 Samyang Innochem to Resume Bisphenol-A Facility .......24 Chang Chun Chemical’s New Bisphenol-A Plant Commences Operations ..................................................25 Lihuayi Weiyuan Chemical Co Ltd Selects Badger Licensing for Bisphenol-A Plant Technology ....................................25 LG Chem to Resume Bisphenol-A Facility ........................25 Sistema Takes Over United Petrochemical Company ......25 PTT Phenol Company Limited Divests Stake to PTT Global Chemical Public Company Limited ...................................25 Sinopec Mitsubishi Chemical Polycarbonate Resumes BPA Plant ................................................................................26 LG Chem Awards Licensing Contracts to Badger ..............26 Sinopec- Mitsubishi Chemical Joint Venture’s BPA Plant Commissioned .................................................................26 PART B: REGIONAL MARKET PERSPECTIVE ... 44 Chart 18: The Largest Regions in Terms of Projected Growth (2016-2022) for Bisphenol-A Market by Geographic Region – North America, Europe, Asia-Pacific and Rest of World ..... 44 Volume Analysis....................................................... 45 Chart 19: Global Bisphenol-A Market Analysis (2012-2022) by Geographic Region – North America, Europe, Asia- Pacific and Rest of World in '000 Metric Tons ................. 45 Chart 20: Glance at 2012, 2017 and 2022 Global Bisphenol-A Volume Market Share (%) by Geographic Region – North America, Europe, Asia-Pacific and Rest of World .............................................................................. 46 4. GLOBAL MARKET OVERVIEW............................. 27 Chart 1: Global Bisphenol-A Market Overview (2012-2022) in Volume ('000 Metric Tons) and Value (USD Million) ....27 4.1 Global Market Overview by Application ............ 28 Volume Analysis ....................................................... 28 Chart 2: Global Bisphenol-A Market Analysis (2012-2022) by Application – Epoxy Resins, Polycarbonates and Other Applications in '000 Metric Tons .....................................28 Chart 3: Glance at 2012, 2017 and 2022 Global Bisphenol- A Volume Market Share (%) by Application – Epoxy Resins, Polycarbonates and Other Applications ..........................29 Click here to buy the report Page 3
Bisphenol-A – A Global Market Overview Feb 2016 |194 Pages | 146 Charts | Price $3960 Chart 58: Glance at 2012, 2017 and 2022 European Bisphenol-A Volume Market Share (%) by Region – France, Germany, Italy, Russia, United Kingdom and Rest of Europe ............................................................................ 88 Value Analysis .......................................................... 89 Chart 59: European Bisphenol-A Market Analysis (2012- 2022) by Region – France, Germany, Italy, Russia, United Kingdom and Rest of Europe in USD Million ................... 89 Chart 60: Glance at 2012, 2017 and 2022 European Bisphenol-A Value Market Share (%) by Region – France, Germany, Italy, Russia, United Kingdom and Rest of Europe ............................................................................ 90 2.2 European Market Overview by Application ....... 91 Volume Analysis....................................................... 91 Chart 61: European Bisphenol-A Market Analysis (2012- 2022) by Application – Epoxy Resins, Polycarbonates and Other Applications in '000 Metric Tons ........................... 91 Chart 62: Glance at 2012, 2017 and 2022 European Bisphenol-A Volume Market Share (%) by Application – Epoxy Resins, Polycarbonates and Other Applications .... 92 Value Analysis .......................................................... 93 Chart 63: European Bisphenol-A Market Analysis (2012- 2022) by Application – Epoxy Resins, Polycarbonates and Other Applications in USD Million ................................... 93 Chart 64: Glance at 2012, 2017 and 2022 European Bisphenol-A Value Market Share (%) by Application – Epoxy Resins, Polycarbonates and Other Applications .... 94 2.2.1 European Bisphenol-A Application Market Overview by Region ................................................. 95 2.2.1.1 Epoxy Resins ................................................ 95 Volume Analysis....................................................... 95 Chart 65: European Bisphenol-A Market Analysis (2012- 2022) in Epoxy Resins by Region – France, Germany, Italy, Russia, United Kingdom and Rest of Europe in '000 Metric Tons ................................................................................ 95 Chart 66: Glance at 2012, 2017 and 2022 European Bisphenol-A Volume Market Share (%) in Epoxy Resins by Region – France, Germany, Italy, Russia, United Kingdom and Rest of Europe .......................................................... 96 Value Analysis .......................................................... 97 Chart 67: European Bisphenol-A Market Analysis (2012-2022) in Epoxy Resins by Region – France, Germany, Italy, Russia, United Kingdom and Rest of Europe in USD Million ............. 97 Chart 68: Glance at 2012, 2017 and 2022 European Bisphenol-A Value Market Share (%) in Epoxy Resins by Region – France, Germany, Italy, Russia, United Kingdom and Rest of Europe .......................................................... 98 2.2.1.2 Polycarbonates ............................................ 99 Volume Analysis....................................................... 99 Chart 69: European Bisphenol-A Market Analysis (2012- 2022) in Polycarbonates by Region – France, Germany, Italy, Russia, United Kingdom and Rest of Europe in '000 Metric Tons ..................................................................... 99 Chart 70: Glance at 2012, 2017 and 2022 European Bisphenol-A Volume Market Share (%) in Polycarbonates by Region – France, Germany, Italy, Russia, United Kingdom and Rest of Europe ......................................... 100 Value Analysis ........................................................ 101 Chart 71: European Bisphenol-A Market Analysis (2012- 2022) in Polycarbonates by Region – France, Germany, Italy, Russia, United Kingdom and Rest of Europe in USD Million ........................................................................... 101 Chart 72: Glance at 2012, 2017 and 2022 European Bisphenol-A Value Market Share (%) in Polycarbonates by Region – France, Germany, Italy, Russia, United Kingdom and Rest of Europe ........................................................ 102 2.2.1.3 Other Applications ..................................... 103 Volume Analysis..................................................... 103 Chart 73: European Bisphenol-A Market Analysis (2012- 2022) in Other Applications by Region – France, Germany, Italy, Russia, United Kingdom and Rest of Europe in '000 Metric Tons ................................................................... 103 Chart 74: Glance at 2012, 2017 and 2022 European Bisphenol-A Volume Market Share (%) in Other Applications by Region – France, Germany, Italy, Russia, United Kingdom and Rest of Europe ............................. 104 1.2.1.3 Other Applications ....................................... 66 Volume Analysis ....................................................... 66 Chart 40: North American Bisphenol-A Market Analysis (2012-2022) in Other Applications by Region – United States, Canada and Mexico in '000 Metric Tons ..............66 Chart 41: Glance at 2012, 2017 and 2022 North American Bisphenol-A Volume Market Share (%) in Other Applications by Region – United States, Canada and Mexico.................. 67 Value Analysis .......................................................... 68 Chart 42: North American Bisphenol-A Market Analysis (2012-2022) in Other Applications by Region – United States, Canada and Mexico in USD Million ......................68 Chart 43: Glance at 2012, 2017 and 2022 North American Bisphenol-A Value Market Share (%) in Other Applications by Region – United States, Canada and Mexico ...............69 1.3 Major Market Players ........................................ 70 Altivia Petrochemicals Llc (United States)........................70 Badger Licensing Llc (United States) ................................70 Hexion Inc. (United States) ..............................................71 Olin Corporation (United States) .....................................72 Sabic Innovative Plastics Us Llc (United States) ...............73 1.4 North American Bisphenol-A Market Overview by Country .................................................................... 74 1.4.1 The United States ......................................... 74 Volume Analysis ....................................................... 74 Chart 44: United States Bisphenol-A Market Analysis (2012- 2022) by Application – Epoxy Resins, Polycarbonates and Other Applications in '000 Metric Tons ............................... 74 Chart 45: Glance at 2012, 2017 and 2022 United States Bisphenol-A Volume Market Share (%) by Application – Epoxy Resins, Polycarbonates and Other Applications ....75 Value Analysis .......................................................... 76 Chart 46: United States Bisphenol-A Market Analysis (2012-2022) by Application – Epoxy Resins, Polycarbonates and Other Applications in USD Million ...76 Chart 47: Glance at 2012, 2017 and 2022 United States Bisphenol-A Value Market Share (%) by Application – Epoxy Resins, Polycarbonates and Other Applications ....77 1.4.2 Canada......................................................... 78 Volume Analysis ....................................................... 78 Chart 48: Canadian Bisphenol-A Market Analysis (2012- 2022) by Application – Epoxy Resins, Polycarbonates and Other Applications in '000 Metric Tons ...........................78 Chart 49: Glance at 2012, 2017 and 2022 Canadian Bisphenol-A Volume Market Share (%) by Application – Epoxy Resins, Polycarbonates and Other Applications ....79 Value Analysis .......................................................... 80 Chart 50: Canadian Bisphenol-A Market Analysis (2012- 2022) by Application – Epoxy Resins, Polycarbonates and Other Applications in USD Million ...................................80 Chart 51: Glance at 2012, 2017 and 2022 Canadian Bisphenol-A Value Market Share (%) by Application – Epoxy Resins, Polycarbonates and Other Applications ....81 1.4.3 Mexico ......................................................... 82 Volume Analysis ....................................................... 82 Chart 52: Mexican Bisphenol-A Market Analysis (2012- 2022) by Application – Epoxy Resins, Polycarbonates and Other Applications in '000 Metric Tons ...........................82 Chart 53: Glance at 2012, 2017 and 2022 Mexican Bisphenol-A Volume Market Share (%) by Application – Epoxy Resins, Polycarbonates and Other Applications ....83 Value Analysis .......................................................... 84 Chart 54: Mexican Bisphenol-A Market Analysis (2012- 2022) by Application – Epoxy Resins, Polycarbonates and Other Applications in USD Million ...................................84 Chart 55: Glance at 2012, 2017 and 2022 Mexican Bisphenol-A Value Market Share (%) by Application – Epoxy Resins, Polycarbonates and Other Applications ....85 Value Analysis ........................................................ 105 Chart 75: European Bisphenol-A Market Analysis (2012- 2022) in Other Applications by Region – France, Germany, Italy, Russia, United Kingdom and Rest of Europe in USD Million .......................................................................... 105 Chart 76: Glance at 2012, 2017 and 2022 European Bisphenol-A Value Market Share (%) in Other Applications by Region – France, Germany, Italy, Russia, United Kingdom and Rest of Europe ........................................ 106 2.3 Major Market Players ...................................... 107 Covestro AG (Germany) ................................................ 107 Kazanorgsintez PJSC (Russia) ........................................ 107 United Petrochemical Company Jsc (Russia) ................. 108 2.4 European Bisphenol-A Market Overview by Country .................................................................. 109 2.4.1 France ........................................................ 109 Volume Analysis .................................................... 109 Chart 77: French Bisphenol-A Market Analysis (2012-2022) by Application – Epoxy Resins, Polycarbonates and Other Applications in '000 Metric Tons ................................... 109 Chart 78: Glance at 2012, 2017 and 2022 French Bisphenol-A Volume Market Share (%) by Application – Epoxy Resins, Polycarbonates and Other Applications . 110 Value Analysis ........................................................ 111 Chart 79: French Bisphenol-A Market Analysis (2012-2022) by Application – Epoxy Resins, Polycarbonates and Other Applications in USD Million .......................................... 111 Chart 80: Glance at 2012, 2017 and 2022 French Bisphenol-A Value Market Share (%) by Application – Epoxy Resins, Polycarbonates and Other Applications . 112 2.4.2 Germany .................................................... 113 Volume Analysis .................................................... 113 Chart 81: German Bisphenol-A Market Analysis (2012- 2022) by Application – Epoxy Resins, Polycarbonates and Other Applications in '000 Metric Tons ........................ 113 Chart 82: Glance at 2012, 2017 and 2022 German Bisphenol-A Volume Market Share (%) by Application – Epoxy Resins, Polycarbonates and Other Applications . 114 Value Analysis ........................................................ 115 Chart 83: German Bisphenol-A Market Analysis (2012- 2022) by Application – Epoxy Resins, Polycarbonates and Other Applications in USD Million ................................ 115 Chart 84: Glance at 2012, 2017 and 2022 German Bisphenol-A Value Market Share (%) by Application – Epoxy Resins, Polycarbonates and Other Applications . 116 2.4.3 Italy ........................................................... 117 Volume Analysis .................................................... 117 Chart 85: Italian Bisphenol-A Market Analysis (2012-2022) by Application – Epoxy Resins, Polycarbonates and Other Applications in '000 Metric Tons ................................... 117 Chart 86: Glance at 2012, 2017 and 2022 Italian Bisphenol- A Volume Market Share (%) by Application – Epoxy Resins, Polycarbonates and Other Applications ........................ 118 Value Analysis ........................................................ 119 Chart 87: Italian Bisphenol-A Market Analysis (2012-2022) by Application – Epoxy Resins, Polycarbonates and Other Applications in USD Million .......................................... 119 Chart 88: Glance at 2012, 2017 and 2022 Italian Bisphenol- A Value Market Share (%) by Application – Epoxy Resins, Polycarbonates and Other Applications ........................ 120 2.4.4 Russia ........................................................ 121 Volume Analysis .................................................... 121 Chart 89: Russian Bisphenol-A Market Analysis (2012- 2022) by Application – Epoxy Resins, Polycarbonates and Other Applications in '000 Metric Tons ........................ 121 Chart 90: Glance at 2012, 2017 and 2022 Russian Bisphenol-A Volume Market Share (%) by Application – Epoxy Resins, Polycarbonates and Other Applications . 122 Value Analysis ........................................................ 123 Chart 91: Russian Bisphenol-A Market Analysis (2012- 2022) by Application – Epoxy Resins, Polycarbonates and Other Applications in USD Million ................................ 123 Chart 92: Glance at 2012, 2017 and 2022 Russian Bisphenol-A Value Market Share (%) by Application – Epoxy Resins, Polycarbonates and Other Applications . 124 2. EUROPE ............................................................ 86 Chart 56: European Bisphenol-A Market Overview (2012-2022) in Volume ('000 Metric Tons) and Value (USD Million) ........... 86 2.1 European Market Overview by Region .............. 87 Volume Analysis ....................................................... 87 Chart 57: European Bisphenol-A Market Analysis (2012- 2022) by Region – France, Germany, Italy, Russia, United Kingdom and Rest of Europe in '000 Metric Tons ............87 Click here to buy the report Page 4
Bisphenol-A – A Global Market Overview Feb 2016 |194 Pages | 146 Charts | Price $3960 2.4.5 The United Kingdom .................................. 125 Volume Analysis ..................................................... 125 Chart 93: United Kingdom Bisphenol-A Market Analysis (2012-2022) by Application – Epoxy Resins, Polycarbonates and Other Applications in '000 Metric Tons ...................... 125 Chart 94: Glance at 2012, 2017 and 2022 United Kingdom Bisphenol-A Volume Market Share (%) by Application – Epoxy Resins, Polycarbonates and Other Applications .. 126 Value Analysis ........................................................ 127 Chart 95: United Kingdom Bisphenol-A Market Analysis (2012-2022) by Application – Epoxy Resins, Polycarbonates and Other Applications in USD Million . 127 Chart 96: Glance at 2012, 2017 and 2022 United Kingdom Bisphenol-A Value Market Share (%) by Application – Epoxy Resins, Polycarbonates and Other Applications .. 128 Value Analysis ........................................................ 144 Chart 112: Asia-Pacific Bisphenol-A Market Analysis (2012- 2022) in Epoxy Resins by Region – China, India, Japan, South Korea and Rest of Asia-Pacific in USD Million ...... 144 Chart 113: Glance at 2012, 2017 and 2022 Asia-Pacific Bisphenol-A Value Market Share (%) in Epoxy Resins by Region – China, India, Japan, South Korea and Rest of Asia- Pacific ........................................................................... 145 3.2.1.2 Polycarbonates .......................................... 146 Volume Analysis..................................................... 146 Chart 114: Asia-Pacific Bisphenol-A Market Analysis (2012- 2022) in Polycarbonates by Region – China, India, Japan, South Korea and Rest of Asia-Pacific in '000 Metric Tons . 146 Chart 115: Glance at 2012, 2017 and 2022 Asia-Pacific Bisphenol-A Volume Market Share (%) in Polycarbonates by Region – China, India, Japan, South Korea and Rest of Asia-Pacific .................................................................... 147 Value Analysis ........................................................ 148 Chart 116: Asia-Pacific Bisphenol-A Market Analysis (2012- 2022) in Polycarbonates by Region – China, India, Japan, South Korea and Rest of Asia-Pacific in USD Million ...... 148 Chart 117: Glance at 2012, 2017 and 2022 Asia-Pacific Bisphenol-A Value Market Share (%) in Polycarbonates by Region – China, India, Japan, South Korea and Rest of Asia- Pacific ........................................................................... 149 3.2.1.3 Other Applications ..................................... 150 Volume Analysis..................................................... 150 Chart 118: Asia-Pacific Bisphenol-A Market Analysis (2012- 2022) in Other Applications by Region – China, India, Japan, South Korea and Rest of Asia-Pacific in '000 Metric Tons . 150 Chart 119: Glance at 2012, 2017 and 2022 Asia-Pacific Bisphenol-A Volume Market Share (%) in Other Applications by Region – China, India, Japan, South Korea and Rest of Asia-Pacific ................................................. 151 Value Analysis ........................................................ 152 Chart 120: Asia-Pacific Bisphenol-A Market Analysis (2012- 2022) in Other Applications by Region – China, India, Japan, South Korea and Rest of Asia-Pacific in USD Million ......... 152 Chart 121: Glance at 2012, 2017 and 2022 Asia-Pacific Bisphenol-A Value Market Share (%) in Other Applications by Region – China, India, Japan, South Korea and Rest of Asia-Pacific .................................................................... 153 3.3 Major Market Players ...................................... 154 Chang Chun Plastics Co Ltd (Taiwan) ............................. 154 Chang Chun Chemical (JiangSu) Co Ltd (China) ............. 154 China National Bluestar (Group) Co Ltd (China) ............ 155 Nantong Xingchen Synthetic Material Co Ltd (China) .... 155 Idemitsu Kosan Co Ltd (Japan) ...................................... 156 Kingboard Chemical Holdings Ltd (Hong Kong) ............. 157 Kumho P&B Chemicals Inc (South Korea) ...................... 158 Lg Chem Ltd (South Korea) ............................................ 158 Mitsubishi Chemical Corporation (Japan)...................... 159 Mitsui Chemicals Inc (Japan) ......................................... 159 Nan Ya Plastics Corporation (Taiwan) ........................... 160 Nippon Steel & Sumikin Chemical Co Ltd (Japan) .......... 161 Ptt Phenol Company Limited (Thailand) ........................ 161 Samyang Innochem Corporation (South Korea) ............ 162 Shanghai Sinopec Mitsui Chemicals Co Ltd (China) ....... 162 Taiwan Prosperity Chemical Corporation (Taiwan) ....... 162 3.4 Asia-Pacific Bisphenol-A Market Overview by Country .................................................................. 163 3.4.2 India........................................................... 167 Volume Analysis .................................................... 167 Chart 126: Indian Bisphenol-A Market Analysis (2012-2022) by Application – Epoxy Resins, Polycarbonates and Other Applications in '000 Metric Tons ....................................... 167 Chart 127: Glance at 2012, 2017 and 2022 Indian Bisphenol- A Volume Market Share (%) by Application – Epoxy Resins, Polycarbonates and Other Applications ............................ 168 Value Analysis ........................................................ 169 Chart 128: Indian Bisphenol-A Market Analysis (2012-2022) by Application – Epoxy Resins, Polycarbonates and Other Applications in USD Million................................................ 169 Chart 129: Glance at 2012, 2017 and 2022 Indian Bisphenol- A Value Market Share (%) by Application – Epoxy Resins, Polycarbonates and Other Applications ............................ 170 2.4.6 Rest of Europe ........................................... 129 Volume Analysis ..................................................... 129 Chart 97: Rest of Europe Bisphenol-A Market Analysis (2012- 2022) by Application – Epoxy Resins, Polycarbonates and Other Applications in '000 Metric Tons ............................. 129 Chart 98: Glance at 2012, 2017 and 2022 Rest of Europe Bisphenol-A Volume Market Share (%) by Application – Epoxy Resins, Polycarbonates and Other Applications .. 130 Value Analysis ........................................................ 131 Chart 99: Rest of Europe Bisphenol-A Market Analysis (2012-2022) by Application – Epoxy Resins, Polycarbonates and Other Applications in USD Million . 131 Chart 100: Glance at 2012, 2017 and 2022 Rest of Europe Bisphenol-A Value Market Share (%) by Application – Epoxy Resins, Polycarbonates and Other Applications .. 132 3.4.3 Japan ......................................................... 171 Volume Analysis .................................................... 171 Chart 130: Japanese Bisphenol-A Market Analysis (2012- 2022) by Application – Epoxy Resins, Polycarbonates and Other Applications in '000 Metric Tons ............................. 171 Chart 131: Glance at 2012, 2017 and 2022 Japanese Bisphenol-A Volume Market Share (%) by Application – Epoxy Resins, Polycarbonates and Other Applications ..... 172 Value Analysis ........................................................ 173 Chart 132: Japanese Bisphenol-A Market Analysis (2012- 2022) by Application – Epoxy Resins, Polycarbonates and Other Applications in USD Million ..................................... 173 Chart 133: Glance at 2012, 2017 and 2022 Japanese Bisphenol-A Value Market Share (%) by Application – Epoxy Resins, Polycarbonates and Other Applications ................ 174 3. ASIA-PACIFIC................................................... 133 Chart 101: Asia-Pacific Bisphenol-A Market Overview (2012-2022) in Volume ('000 Metric Tons) and Value (USD Million) .......................................................................... 133 3.1 Asia-Pacific Market Overview by Region .......... 134 Volume Analysis ..................................................... 134 Chart 102: Asia-Pacific Bisphenol-A Market Analysis (2012- 2022) by Region – China, India, Japan, South Korea and Rest of Asia-Pacific in '000 Metric Tons ......................... 134 Chart 103: Glance at 2012, 2017 and 2022 Asia-Pacific Bisphenol-A Volume Market Share (%) by Region – China, India, Japan, South Korea and Rest of Asia-Pacific ......... 135 Value Analysis ........................................................ 136 Chart 104: Asia-Pacific Bisphenol-A Market Analysis (2012- 2022) by Region – China, India, Japan, South Korea and Rest of Asia-Pacific in USD Million ................................. 136 Chart 105: Glance at 2012, 2017 and 2022 Asia-Pacific Bisphenol-A Value Market Share (%) by Region – China, India, Japan, South Korea and Rest of Asia-Pacific ......... 137 3.2 Asia-Pacific Market Overview by Application ... 138 Volume Analysis ..................................................... 138 Chart 106: Asia-Pacific Bisphenol-A Market Analysis (2012- 2022) by Application – Epoxy Resins, Polycarbonates and Other Applications in '000 Metric Tons ......................... 138 Chart 107: Glance at 2012, 2017 and 2022 Asia-Pacific Bisphenol-A Volume Market Share (%) by Application – Epoxy Resins, Polycarbonates and Other Applications .. 139 Value Analysis ........................................................ 140 Chart 108: Asia-Pacific Bisphenol-A Market Analysis (2012- 2022) by Application – Epoxy Resins, Polycarbonates and Other Applications in USD Million ................................. 140 Chart 109: Glance at 2012, 2017 and 2022 Asia-Pacific Bisphenol-A Value Market Share (%) by Application – Epoxy Resins, Polycarbonates and Other Applications .. 141 3.2.1 Asia-Pacific Bisphenol-A Application Market Overview by Region ............................................... 142 3.2.1.1 Epoxy Resins .............................................. 142 Volume Analysis ..................................................... 142 Chart 110: Asia-Pacific Bisphenol-A Market Analysis (2012- 2022) in Epoxy Resins by Region – China, India, Japan, South Korea and Rest of Asia-Pacific in '000 Metric Tons ........... 142 Chart 111: Glance at 2012, 2017 and 2022 Asia-Pacific Bisphenol-A Volume Market Share (%) in Epoxy Resins by Region – China, India, Japan, South Korea and Rest of Asia- Pacific ............................................................................ 143 3.4.4 South Korea ............................................... 175 Volume Analysis .................................................... 175 Chart 134: South Korean Bisphenol-A Market Analysis (2012- 2022) by Application – Epoxy Resins, Polycarbonates and Other Applications in '000 Metric Tons ............................. 175 Chart 135: Glance at 2012, 2017 and 2022 South Korean Bisphenol-A Volume Market Share (%) by Application – Epoxy Resins, Polycarbonates and Other Applications ..... 176 Value Analysis ........................................................ 177 Chart 136: South Korean Bisphenol-A Market Analysis (2012- 2022) by Application – Epoxy Resins, Polycarbonates and Other Applications in USD Million ..................................... 177 Chart 137: Glance at 2012, 2017 and 2022 South Korean Bisphenol-A Value Market Share (%) by Application – Epoxy Resins, Polycarbonates and Other Applications ................ 178 3.4.5 Rest of Asia-Pacific ..................................... 179 Volume Analysis .................................................... 179 Chart 138: Rest of Asia-Pacific Bisphenol-A Market Analysis (2012-2022) by Application – Epoxy Resins, Polycarbonates and Other Applications in '000 Metric Tons ...................... 179 Chart 139: Glance at 2012, 2017 and 2022 Rest of Asia- Pacific Bisphenol-A Volume Market Share (%) by Application – Epoxy Resins, Polycarbonates and Other Applications .. 180 Value Analysis ........................................................ 181 Chart 140: Rest of Asia-Pacific Bisphenol-A Market Analysis (2012-2022) by Application – Epoxy Resins, Polycarbonates and Other Applications in USD Million .............................. 181 Chart 141: Glance at 2012, 2017 and 2022 Rest of Asia- Pacific Bisphenol-A Value Market Share (%) by Application – Epoxy Resins, Polycarbonates and Other Applications ..... 182 3.4.1 China ......................................................... 163 Volume Analysis..................................................... 163 Chart 122: Chinese Bisphenol-A Market Analysis (2012- 2022) by Application – Epoxy Resins, Polycarbonates and Other Applications in '000 Metric Tons ......................... 163 Chart 123: Glance at 2012, 2017 and 2022 Chinese Bisphenol-A Volume Market Share (%) by Application – Epoxy Resins, Polycarbonates and Other Applications .. 164 Value Analysis ........................................................ 165 Chart 124: Chinese Bisphenol-A Market Analysis (2012- 2022) by Application – Epoxy Resins, Polycarbonates and Other Applications in USD Million ................................. 165 Chart 125: Glance at 2012, 2017 and 2022 Chinese Bisphenol-A Value Market Share (%) by Application – Epoxy Resins, Polycarbonates and Other Applications .. 166 4. REST OF WORLD .............................................. 183 Chart 142: Rest of World Bisphenol-A Market Overview (2012-2022) in Volume ('000 Metric Tons) and Value (USD Million) ............................................................................... 183 4.1 Rest of World Market Overview by Application184 Volume Analysis .................................................... 184 Chart 143: Rest of World Bisphenol-A Market Analysis (2012- 2022) by Application – Epoxy Resins, Polycarbonates and Other Applications in '000 Metric Tons ............................. 184 Chart 144: Glance at 2012, 2017 and 2022 Rest of World Bisphenol-A Volume Market Share (%) by Application – Epoxy Resins, Polycarbonates and Other Applications . 185 Click here to buy the report Page 5
Bisphenol-A – A Global Market Overview Feb 2016 |194 Pages | 146 Charts | Price $3960 Value Analysis ........................................................ 186 Chart 145: Rest of World Bisphenol-A Market Analysis (2012- 2022) by Application – Epoxy Resins, Polycarbonates and Other Applications in USD Million ..................................... 186 Chart 146: Glance at 2012, 2017 and 2022 Rest of World Bisphenol-A Value Market Share (%) by Application – Epoxy Resins, Polycarbonates and Other Applications................ 187 4.2 Major Market Players ...................................... 188 Khuzestan Petrochemical Company (Iran) .................... 188 Saudi Kayan Petrochemical Company (Saudi Arabia) .... 188 PART D: ANNEXURE .................................... 193 1. RESEARCH METHODOLOGY ............................. 193 2. FEEDBACK ....................................................... 195 PART C: GUIDE TO THE INDUSTRY ............... 189 1. NORTH AMERICA ........................................................ 189 2. EUROPE ....................................................................... 189 3. ASIA-PACIFIC ............................................................... 190 4. REST OF WORLD .......................................................... 192 About Industry Experts Industry Experts values the most updated and accurate market research and industry analysis to provide unique market research reports for a broad range of industry verticals including Automotive, Transportation, Healthcare, Pharmaceuticals, Food & Beverages, Chemicals, Plastics, Materials, Consumer Goods, Retail, Biotechnology, Construction, Manufacturing and Other industries. Our research reports help our clients to identify and resolve topical issues by providing a complete picture of the market in their respective industry sectors. The Company’s rich collection of market research reports enable the companies to explore market drivers; forecast the future market; and to formulate the right strategies at the right time. INDUSTRY EXPERTS 1-7-19/C, Street No. 8, Habsiguda Hyderabad – 500007, India Phone: +91-40-4018-1314 Fax: +91-40-4027-2381 info@industry-experts.com industry-experts.com Industry Experts’ leading edge publications makes the life easy for corporate strategists, investors, analysts and researchers, start ups, consultants, financial and banking executives, academicians and many more. The company also provides customized research reports to cater the needs of the industry. More about Industry Experts Click here to buy the report Page 6